We often hear about future increases in global mean surface temperature (GMST), but the climate is a complex system, and there is a lot of variability depending on one’s location. A recent study by Suarez-Gutierrez et al. (2020), modelled the most extreme temperatures that could occur around the globe in different scenarios.
—
Simulations were performed using the Max Planck Institute Grand Ensemble model (MPI-GE) (Suarez-Gutierrez et al. (2020)).
On a geological scale, our climate is changing extremely fast. Records are broken every year, be it the worst wildfire season in the last hundred years or the highest summer temperatures the arctic has ever experienced. Worse, the effects of today’s emissions will only be felt forty to fifty years from now, which could easily take us to 2°C above pre-industrial levels, and maybe more. We’ve reached the 1°C mark and the knock-on effects already reverberate around the world. Pollinators are disappearing, extreme weather is expanding its range and intensity, and parts of the biosphere are struggling to adapt to excessive heat.
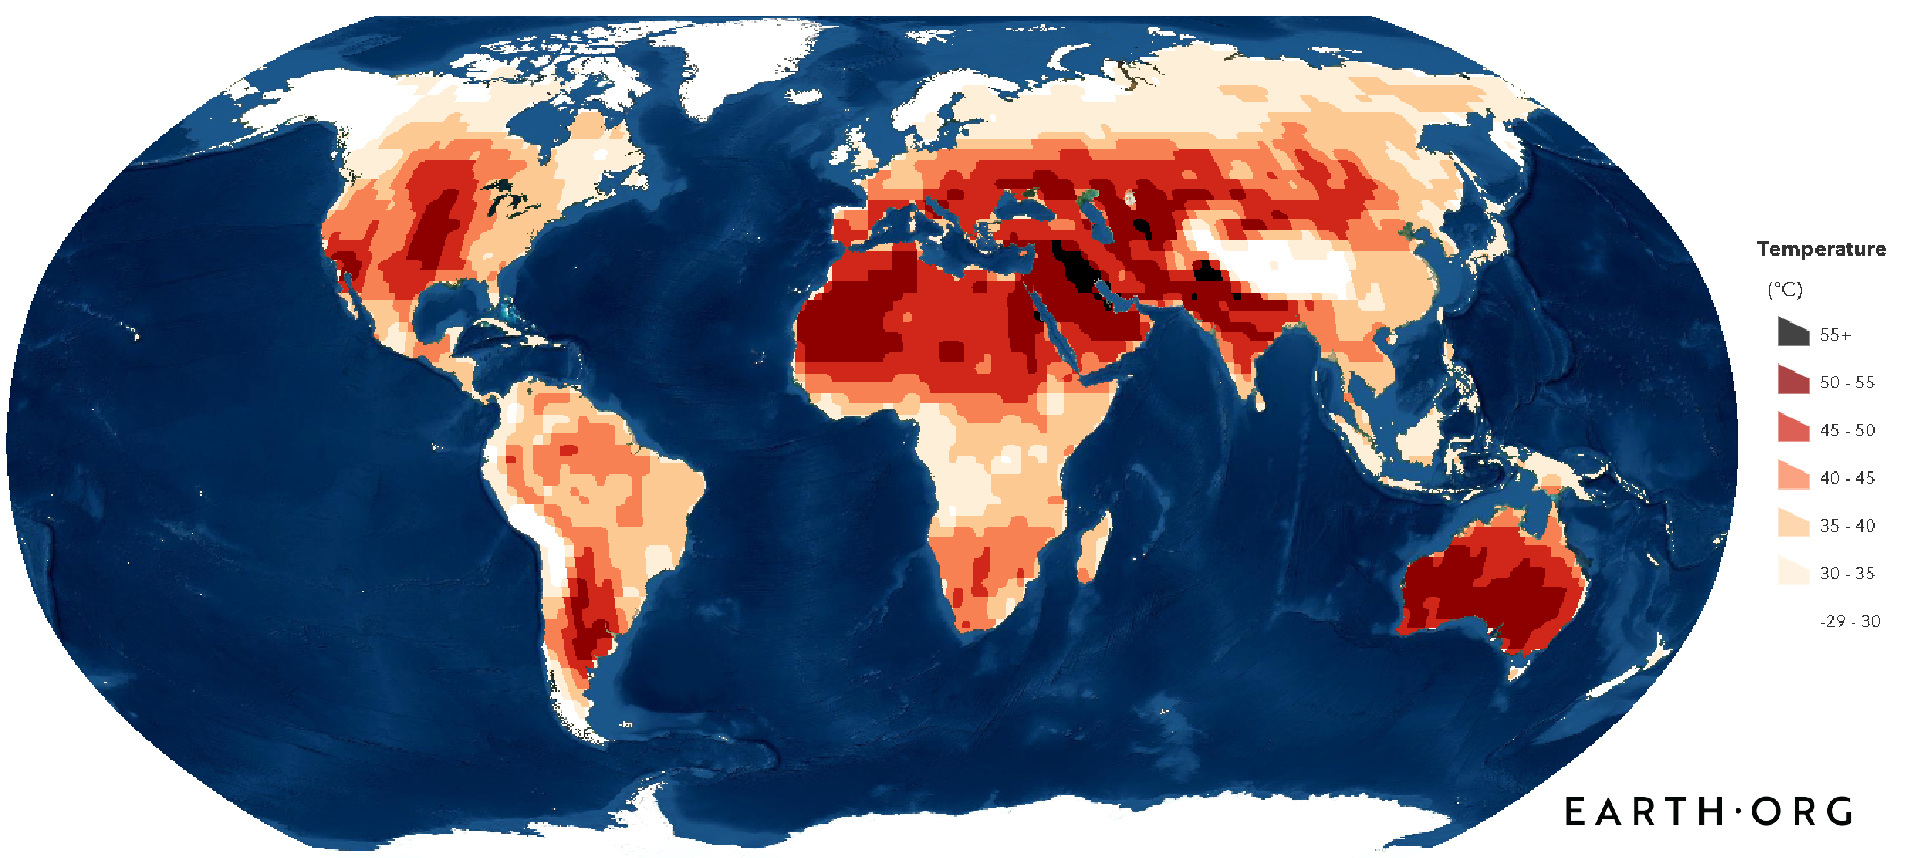
While climatic averages slowly change, extremes gain in amplitude. In the paper “Hotspots of extreme heat under global warming”, summertime temperatures are modelled in scenarios ranging from 0 to 4 degrees global warming. Thousands of simulations provide insight on the occurrence and extent of extreme temperatures the world could experience.

Maximum absolute summer temperatures under a 4°C rise in GMST. The simulated maximum temperatures represent the 99.5th percentile value (0.5% most extreme) at each grid cell.
At 2°C above pre-industrial levels, the MPI-GE model predicts maximum summer heat to stay below 50°C in most places. For 3°C and 4°C scenarios, peak temperatures above 50°C appear in every continent, even going above 55°C in some cases. While the average day will still be bearable, sudden onset of extreme temperatures could have a destructive effect on human, animal and environmental health.
Canada’s Canola Fields
Vegetable oil use ranges from cooking to industrial and animal feed. Such widespread applications have led to competition between varieties and thus the rise of palm and canola oil. The latter rose from 6th to 2nd most produced oil crop in the past decade, and its production is expected to rise by another 40% by 2025.

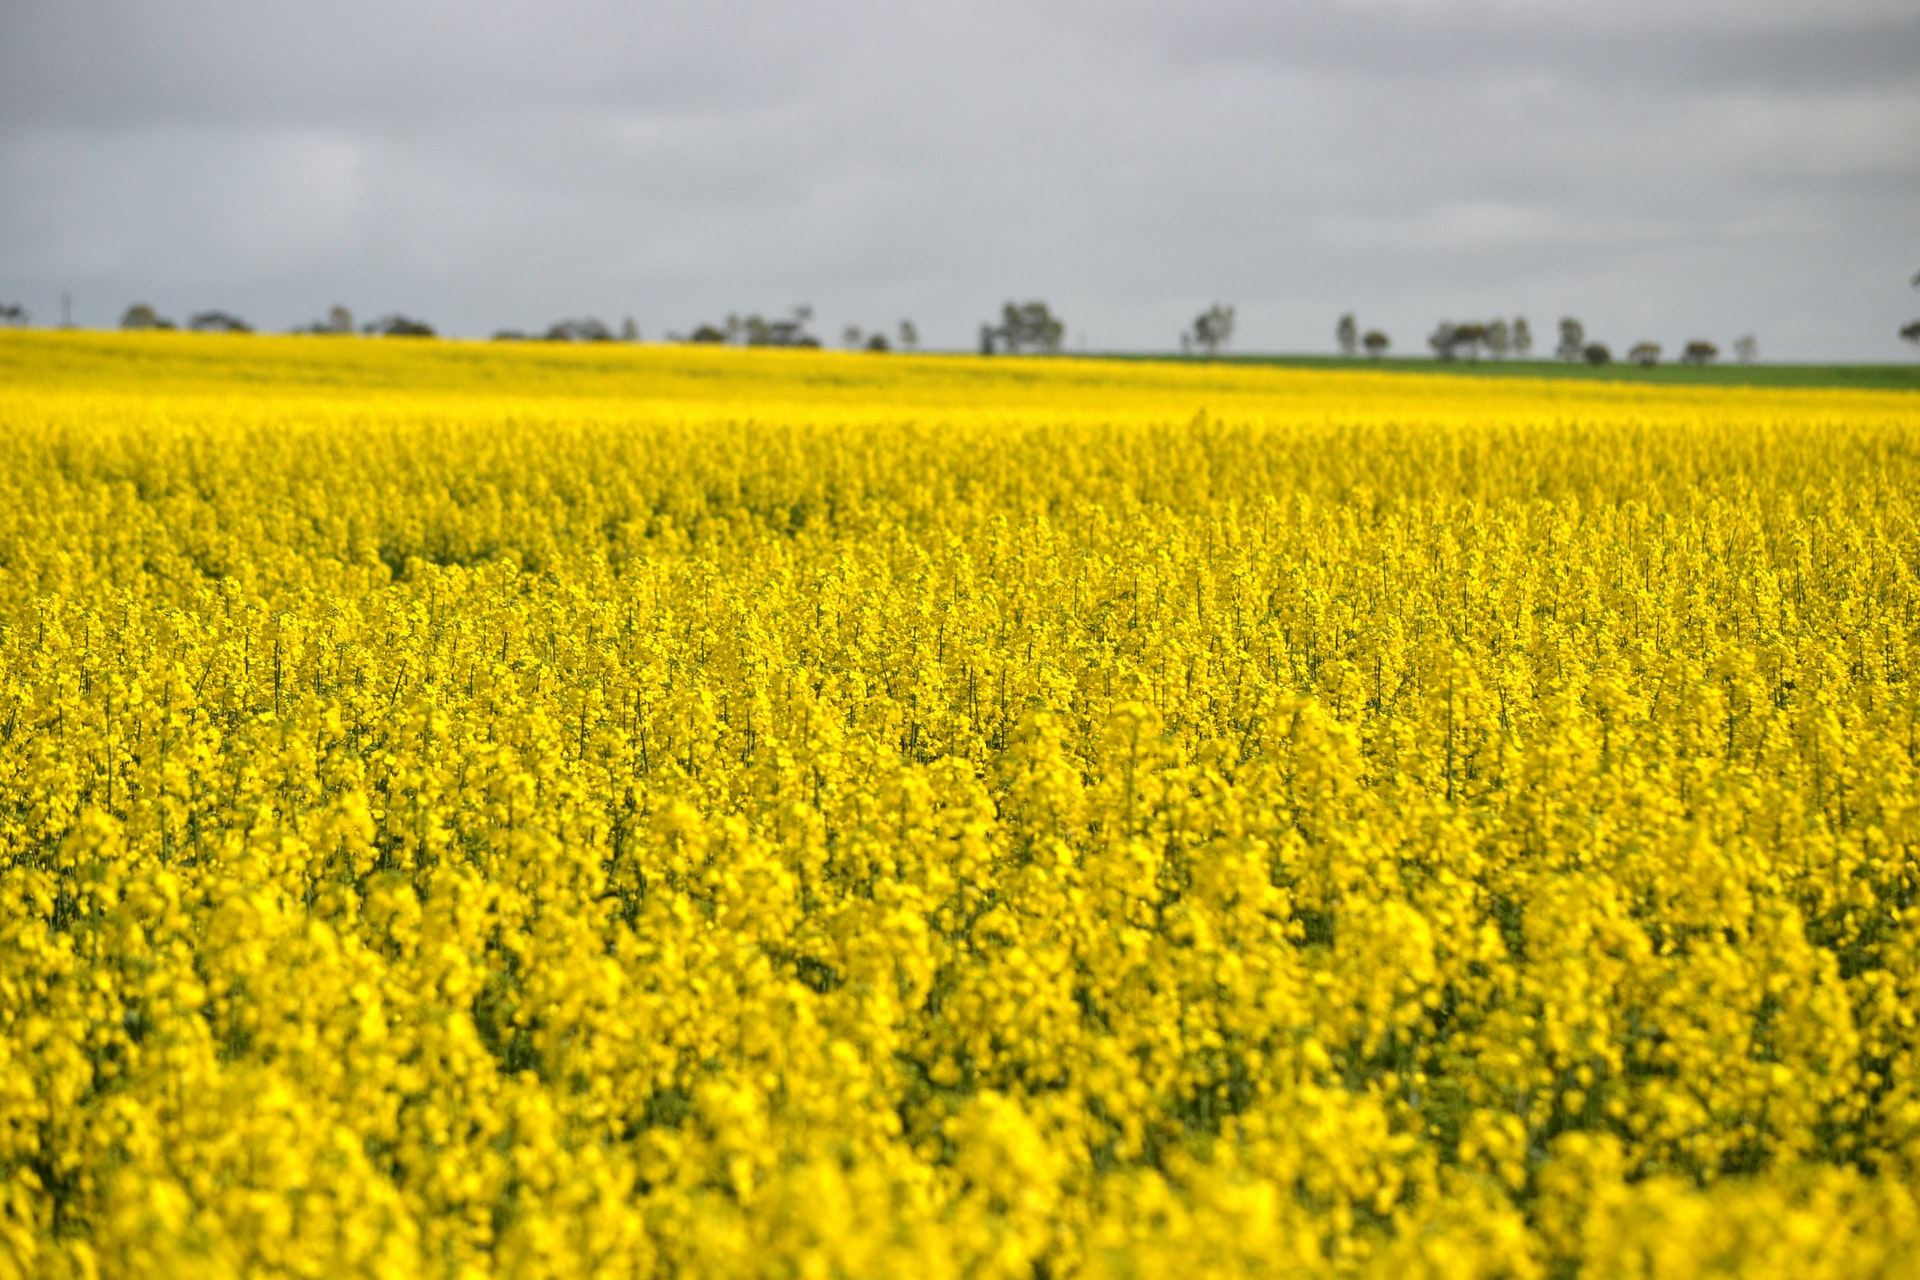
Canola fields. Photo by Michael Obeysekera on Unsplash.
Canada is the world’s leading canola producer, ahead of the EU and China. Over 43,000 Canadian farmers produce a total of 20 million tonnes each year, accounting for ~25% of all Canadian crop sales. The fields are primarily in the south central and southwestern provinces of Alberta, Saskatchewan and Manitoba, with a few smaller plantations in Ontario and Quebec.

Map of Canada’s canola crops. Mapping by Keir Murdo.
Crops can withstand and even find their yields enhanced at high temperatures, but most suffer greatly above the 29 to 32°C range. Some species in tropical areas display higher tolerance to heat, but around 38°C, all chlorophyllic plants suffer from photosynthetic inhibition. Above 45°C, lethal protein denaturation occurs.
The MPI-GE simulations demonstrate that a 2°C rise in global average temperatures could put 53% of canola fields in temperatures above 38°C, thus threatening halted growth or even death.

Map of Canada’s canola fields in a 2°C warmer world. In black, crops exposed to temperatures above 38°C above which photosynthetic inhibition occurs. Mapping by Keir Murdo.
At 4°C, 88% of the crops are exposed to experiencing 38°C or higher.

Map of Canada’s canola fields in a 4°C warmer world. In black, crops exposed to temperatures above 38°C above which photosynthetic inhibition occurs. Mapping by Keir Murdo.
The canola industry creates 250 thousand jobs, US $11.2 billion in wages and US $26.7 billion in total economic activity. In a 4°C world, the instability of the cash crop per se makes the entire industry nonviable, while mitigation costs and potential yield losses in a 2°C world make it questionable at best.
Canada and the Arctic Wildfires
The atmosphere north of the Arctic circle is warming three times faster than the rest of the world, and millenia of dense, frozen carbon reserves are being consumed by wildfires. This is not uncommon but scientists reported “unprecedented levels” of activity last year, with a record breaking 17,000 fire counts in less than two months in Alberta.
Experts believe climate change is creating a more fire-prone environment in the Arctic, as higher temperatures melt permafrost and dry out carbon-dense peat soil. Further, a warmer atmosphere increases the chance of storm formation and lightning strikes. Last year, the National Geographic reported an abnormally high 48 lightning strikes near the north pole, confirming these fears.
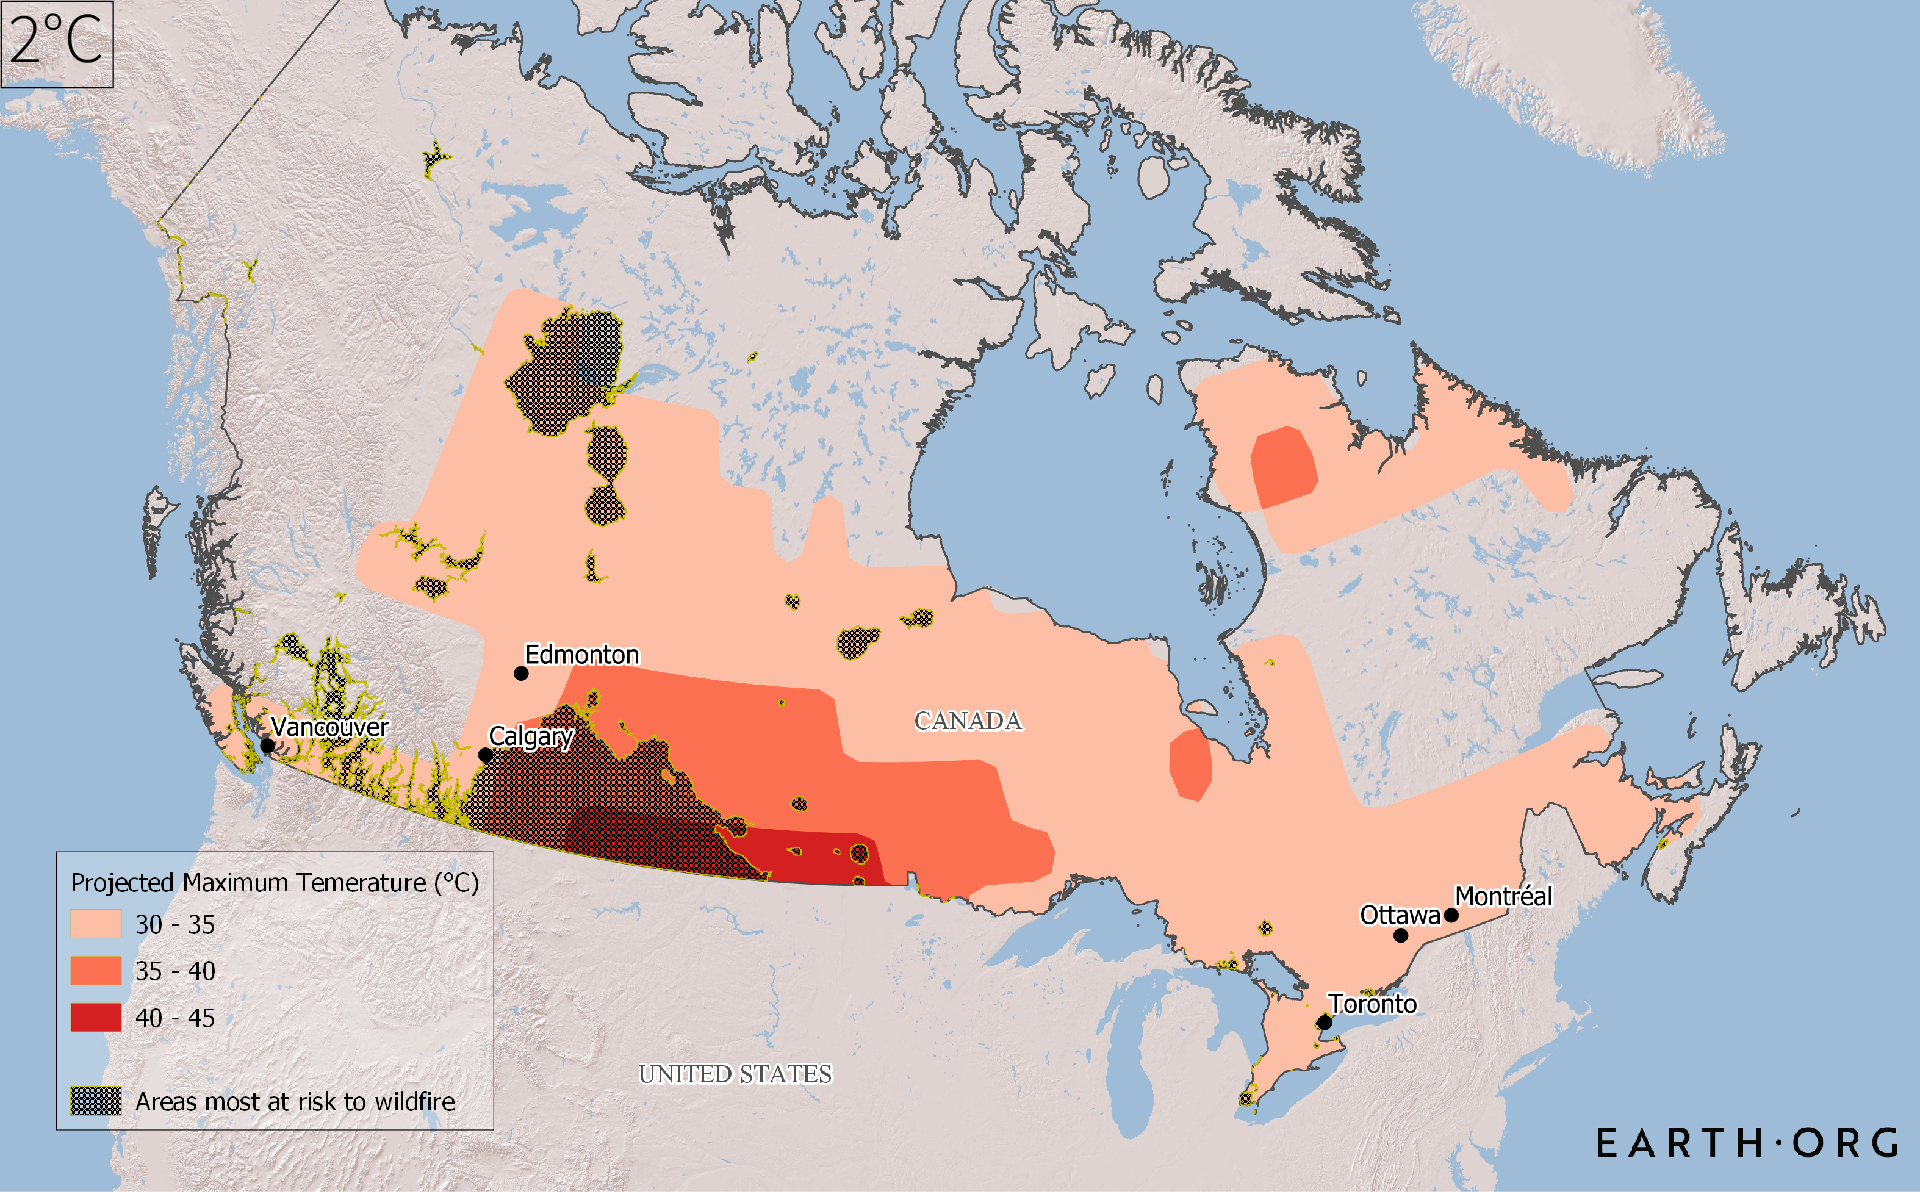
The MPI-GE predicts temperatures far higher than normal could scorch the southern to northern reaches of Canada’s boreal forest, notably in areas where there are already high fire hazards.

Overlaying the projected summer maximum temperatures of the MPI-GE under 2°C and the wildfire risk areas provided by the Canadian Forest Fire Weather Index for the month of July. Mapping by Keir Murdo.
With a 2°C rise above pre-industrial levels, temperatures as high as 30°C become possible over 87.5% of the wildfire risk areas marked in black on the map. Given the usually colder temperatures, this is likely to exacerbate drought and provide more flammable fuel. In the southern regions where canola also grows the occurrence of extreme temperatures could cause blazes on top of heat-driven yield losses. Peak temperatures in the northern portions of Canada’s boreal forest usually reach 15°C, but maximum peaks could jump to 30-35°C.

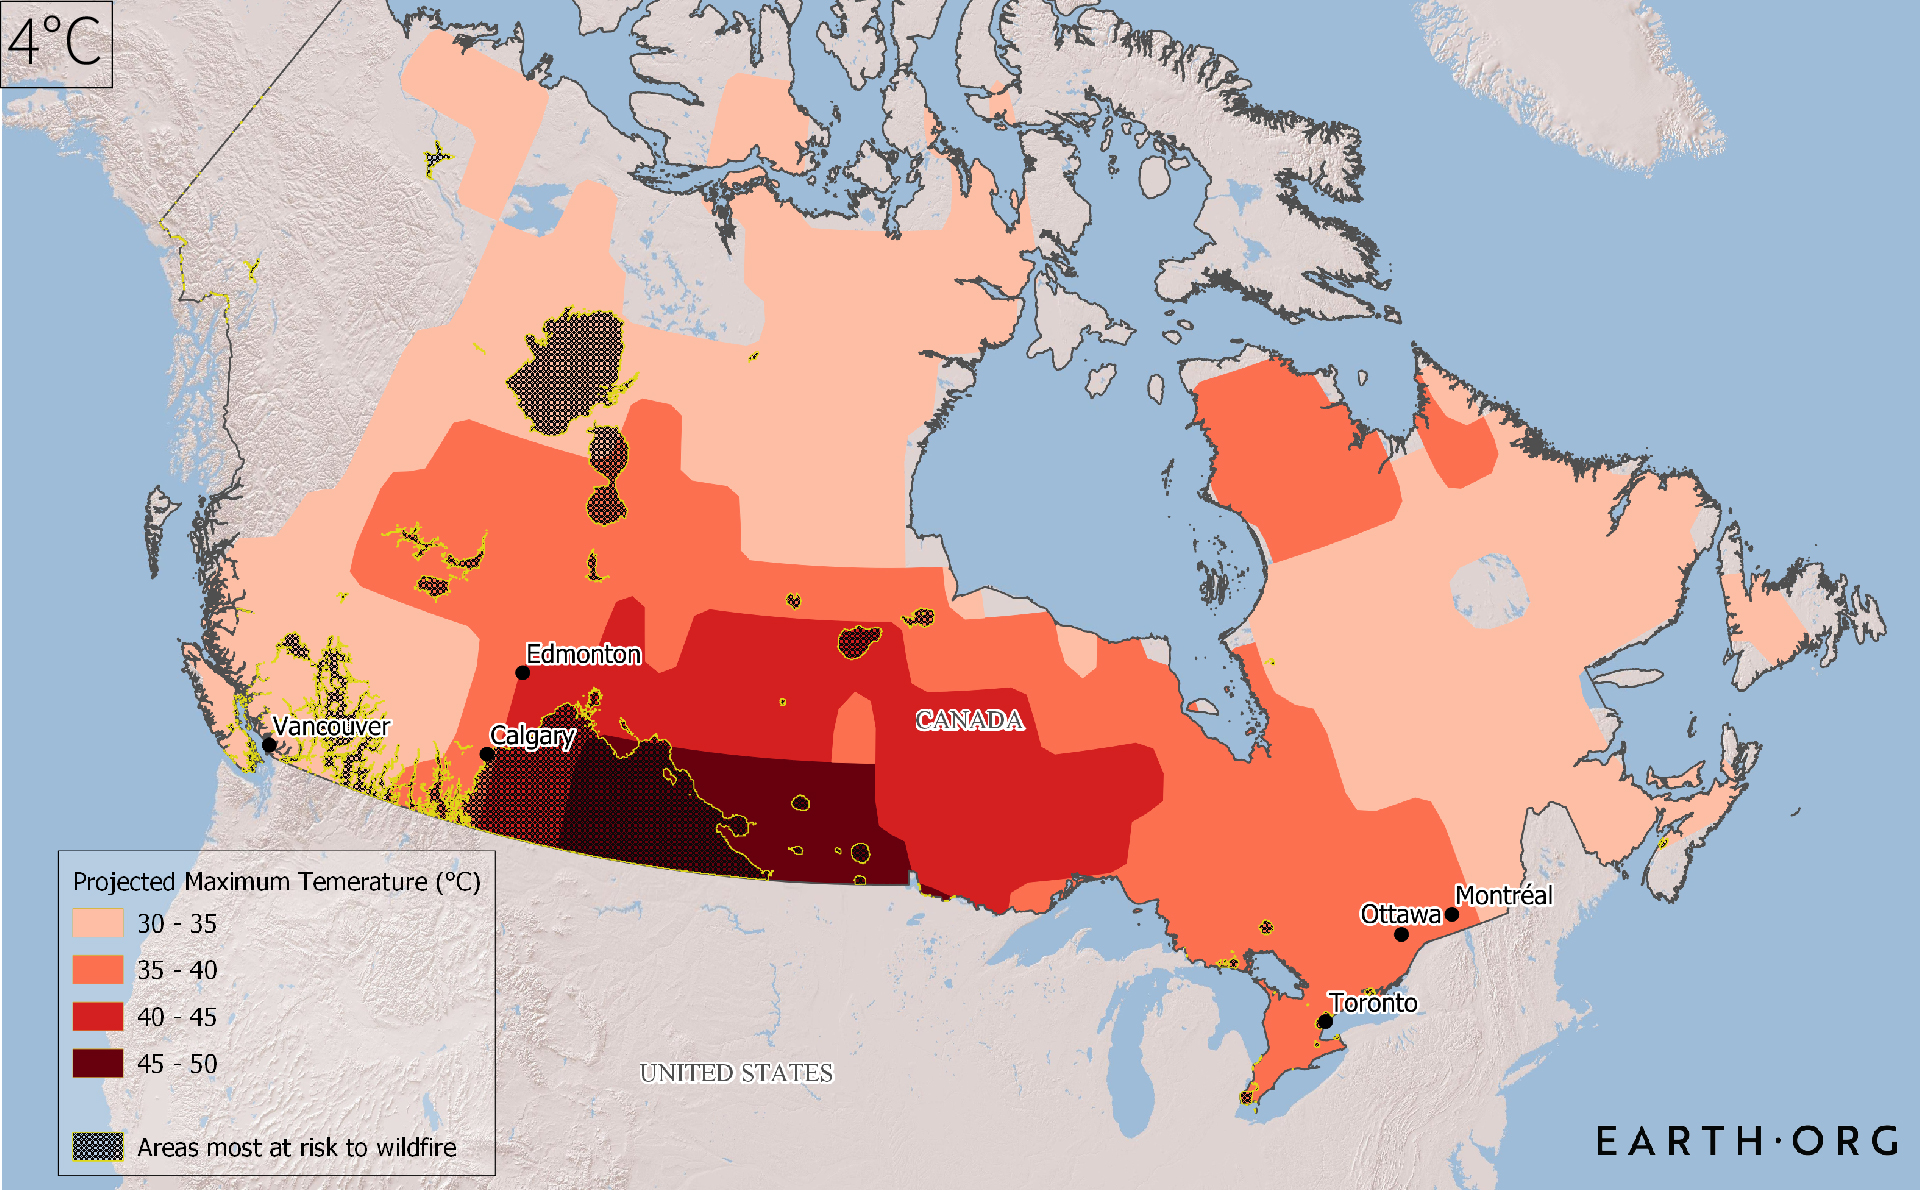
Overlaying the projected summer maximum temperatures of the MPI-GE under 2°C and the wildfire risk areas provided by the Canadian Forest Fire Weather Index for the month of July. Mapping by Keir Murdo.
With 4°C global warming, the 99.1% of the boreal forest could experience 30°C, and down to 54.2% for 40°C. These conditions would surpass anything our planet has seen in the past 125,000 years, and would bring massive changes to an ecosystem that has remained stable for the last 12,000.
The issue with extreme temperatures in this otherwise frozen environment is the massive amount of carbon locked away in its soils. Plant decomposition has been halted by the cold for thousands of years, allowing biomass to accumulate in the form of vast peatlands. The dangerous combination of more frequent lightning and dried up fuel threatens to release these carbon reserves, thus warming the atmosphere and creating a positive feedback loop. There is another sleeping giant: the methane being released as permafrost thaw accelerates adds momentum to the process.
It is important to understand that the seemingly mild predictions of 1°Cto 4°C global warming actually entail massive localized changes depending on where you are. These localized effects can then lead to global knock-on effects that build upon each other to change the world we live in. When adding the fact that the consequences of our actions only take effect around 40 years after the fact, it is crucial for us to act now.
This article was written by Owen Mulhern. Mapping by Keir Murdo.
You might also like: Extreme Temperatures in India Will be Too Hot to Live In
References
-
Government of Canada, Fire Weather Normals: https://cwfis.cfs.nrcan.gc.ca/downloads/gridstats/fwi_normals/fwi_normals_grids_metadata_NAP_ISO_19115_2003_EN.pdf
-
Agriculture and Agri-Food Canada: https://aimis-simia.agr.gc.ca/rp/index-eng.cfm?action=gR&r=243&signature=D332B75063400CC3B9FFD451B5732DC4&pdctc=&pTpl=1#wb-cont
-
Canadian Agri-Food Trade Alliance: http://cafta.org/agri-food-exports/#:~:text=EXPORT%20STATISTICS,of%20our%20food%20processing%20sector.


![The Statistics of Biodiversity Loss [2020 WWF Report]](https://u4d2z7k9.rocketcdn.me/wp-content/uploads/2020/12/lprwinkyTHB-544x306.jpg)


