


Climate Reanalyzer provides a daily look at the state of our climate with a variety of maps, stats and angles. Here, we review the latest as the US struggles with a cold spell, yet the Arctic deals with far higher than normal temperatures.
—
The US is in the grips of an acute cold spell, resulting from the breakdown of the polar vortex. The extreme cold may seem counterintuitive to many after hearing so much about global warming, but a warming trend doesn’t mean extremes and outliers can’t happen. In fact, it may be more accurate to use the term “global weirding”, coined by climate scientist Katharine Hayhoe. By introducing an average 1°C extra heat throughout our atmosphere, what we’ve really done is throw the climate system all out of whack. Air rises and falls just a little faster, just a bit earlier, or later; the atmosphere can hold around 7% more water in it at any given time; ice caps are melting, shifting water currents and changing how much heat is bounced back into space and the list goes on.

Image from Climate Reanalyzer (https://ClimateReanalyzer.org), Climate Change Institute, University of Maine, USA.
Here we see the <2 meter surface temperature map of Feb. 19th 2021. You see the polar temperatures dipping south over the continental US, causing power outages and economic gridlock as far south as Texas.
The cause? There are suggestions that warming in the northern hemisphere has weakened the jetstream, a current that circulates between Europe and North America over the Atlantic Ocean. This ring normally holds the Polar Vortex, a high altitude mass of winter cold air, in place, but it has now collapsed, possibly due to the jet stream’s current instability.
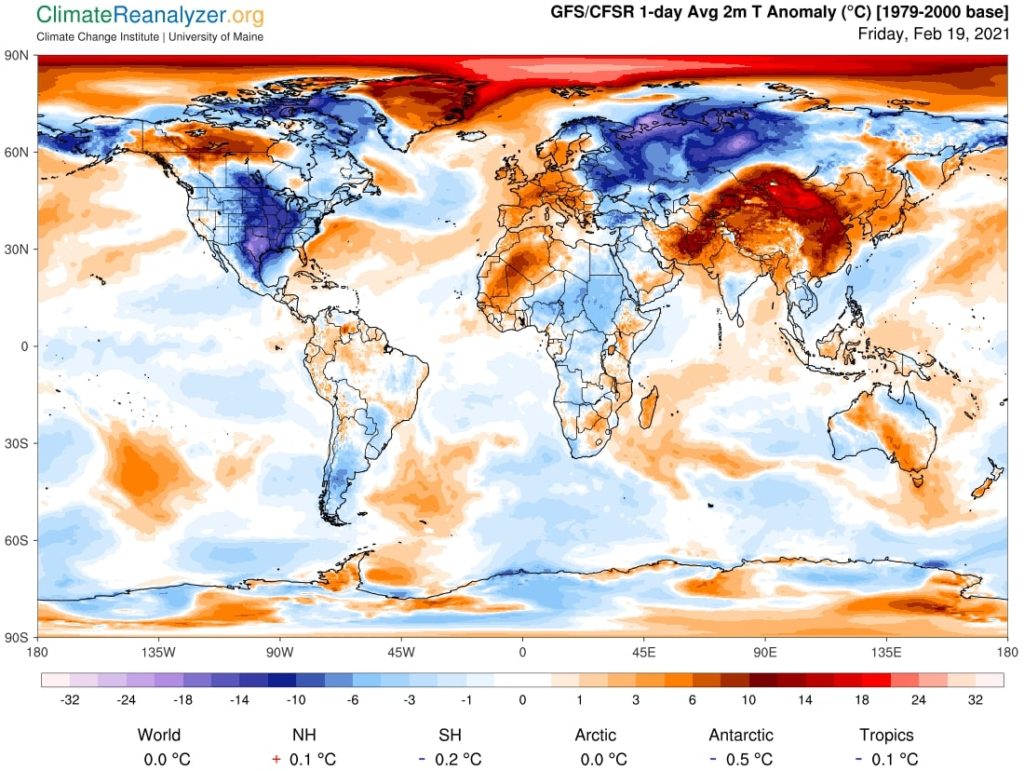
Image from Climate Reanalyzer (https://ClimateReanalyzer.org), Climate Change Institute, University of Maine, USA.
Above we have a different look at the same situation: this is the temperature anomaly map for the same date. Here we can see how far off the 1981-2000 trend we are today (NB: the 80’s were a cooler period in time amidst the warming of the 20th century). This view emphasizes the US cold spell better than the previous, but also denotes the irregularity of the situation – while the US freezes, Greenland and the Arctic is 10-15°C hotter than it should be at this time of year.
This article was written by Owen Mulhern. Cover photo from Climate Reanalyzer (https://ClimateReanalyzer.org), Climate Change Institute, University of Maine, USA.
You might also like: Food Production: Recent History and Where we are Heading


![The Statistics of Biodiversity Loss [2020 WWF Report]](https://earth.org/wp-content/uploads/2020/12/lprwinkyTHB-544x306.jpg)


