Air pollution is the third leading cause of death worldwide, and most large cities, Shanghai included, have fine particulate matter (PM2.5) levels above WHO health guidelines. Here, we take a look air pollution mapping in the Shanghai metropolis to better understand the current situation, and where things may be heading.
—
Since China’s economic reform from a centralized, isolated economy to the open market in 1979, it has been the world’s fastest growing economy, with GDP growth averaging 9.5% through 2018 (now a little under 7% a year). Urbanization accelerated in similar fashion during this period; the proportion of urban population rose from 18% in 1978 to 59% in 2018, totaling 820 million people, well over twice the current US population.
NASA’s Landsat satellites capture the astounding expansion of the Shanghai megalopolis in the images below.

NASA Landsat composite image of the Shanghai Megalopolis, using shots from 1984 to 1988.

NASA Landsat composite image of the Shanghai Megalopolis, using shots from 2013 to 2017.
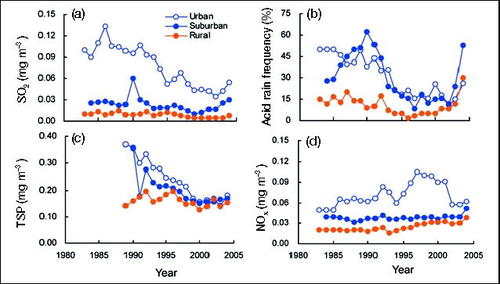
This sprawling agglomeration covers over 7000 square kilometers, which is ~7 times the size of Hong Kong. The striking loss of greenery (mainly cropland) came with degraded water quality, contaminated soil, insufficient housing and sanitation, traffic congestion, local climate alterations and air pollution. Let’s take a closer look at this last one; below is Shanghai air quality data from 1980 to 2005.

Changes in (A) sulfur dioxide (SO2); (b) acid rain frequency; © total suspended particles (TSP); (d) nitrous oxides (NOx). Source: Zhao et al. 2006.
We see high levels of sulfur dioxide (SO2; top left) and total suspended particles (TSP, equivalent to particulate matter, bottom left) throughout the 80s and early 90s. These both mainly came from coal combustion, which was by far the worst source of pollution at the time. This, combined with poor water quality and sewage systems had noticeable effects on health and well-being, leading to public concern. Local authorities rapidly took successful measures to reduce domestic and industrial coal consumption, reflected by the gradual drop in SO2 and TSP between 1980 and 2000. While this was happening, motorized vehicles became more accessible and multiplied by 2000%, leading to an increase in nitrous oxide levels.
There is a tight link between environmental degradation and economic development, and the latter was given priority in 20th Century China. Still, regulatory bodies, a national air pollution monitoring system and pollution control research and development were implemented in the 90s, but failed to make a real difference. According to The Lancet Planetary Health, the average PM2.5 exposure in China only dropped by 9% from 57.8 to 52.7 ????g / m3 between 1990 and 2017. Shanghai’s worst air pollution episode may have been during the 2013 Eastern China smog, when dangerously high levels of fine particulate matter blanketed the city. Readings crossed the 300 ????g / m3 mark on December 2nd; for comparison, the recommended WHO guideline is 10 ????g / m3.
Around this time, multiple studies began assessing the amount of excess deaths due to air pollution in China, along with the economic losses it incurred (which topped US$ 1 billion per year). The Chinese government finally took decisive action and unveiled the US$ 284.2 billion “Airborne Pollution Prevention and Control Action Plan”, specifying targets for PM2.5 reduction by region for 2017, Greater Shanghai’s being 20%.

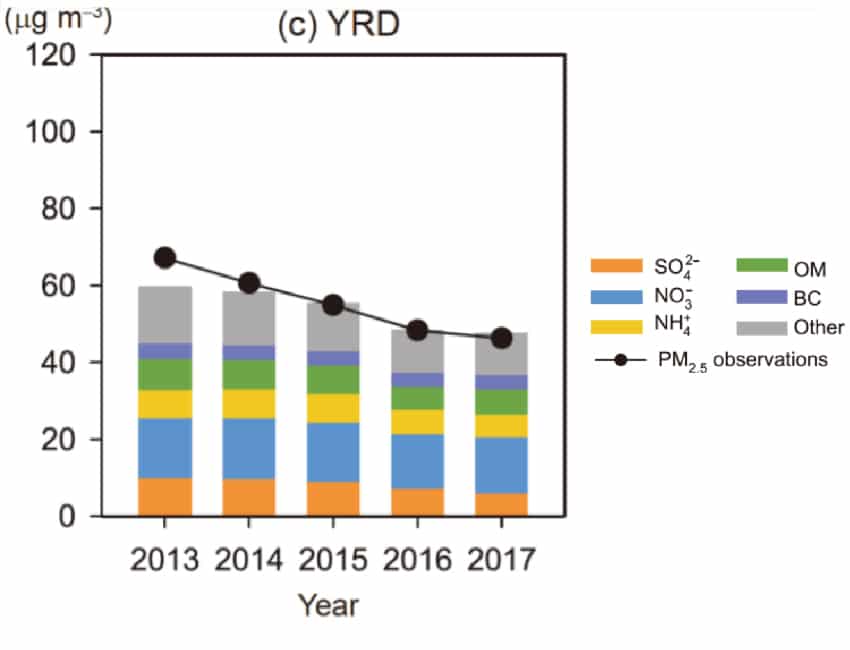
Air quality in the Yangtze River Delta (YRD; where Shanghai is located) over time. Source: Geng et al. (2019)
As you can see above, PM2.5 levels (black line) did indeed drop about 20%, indicating a successful campaign. Having met its goals, China did not relent: it released its second national air pollution action plan, known as the Blue Sky Action Plan, in 2018. Rather than focus on key regions, this plan sets targets for the entire nation, requiring all agglomerations to reduce their PM2.5 by 18% by 2020, using 2015 as a base year.
Shanghai had already reduced air pollution 26% below 2015 levels by 2016, yet local authorities continued their efforts.The local government released the draft of a master plan for 2040 in 2017, calling for PM2.5 to be reduced to about 20 ????g / m3. In the meantime, the city has been exceeding targets for the past five years, now standing at an average 35 ????g / m3, finally meeting international standards. Emission control measures for industry, combined with steady reductions in coal use and cleaner car technologies are to thank for their improvements.
It must be said, however, that 20 ????g / m3 remains harmful to our health. The WHO explains that anything above 10 ????g / m3 will effectively increase our chances of respiratory and cardiovascular diseases.

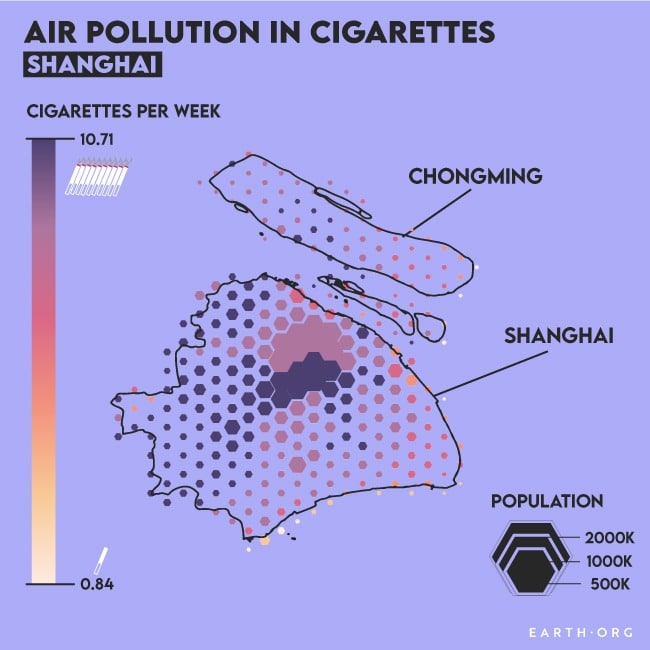
Unfortunately, it seems that even the best efforts of a fully developed country aren’t enough to eliminate the problem. Because the health effects are akin to those of cigarettes, we used Berkeley Earth’s air pollution to cigarette equivalence to illustrate Shanghai air pollution a little differently.
This article was written by Owen Mulhern.
You might also like: Shifting Baselines and the Elusiveness of Climate Change
References
-
https://www.annualreviews.org/doi/pdf/10.1146/annurev.energy.27.122001.083421#:~:text=Dur%2D%20ing%20the%201970s%2C%20black,CO)%2C%20and%20photochemical%20smog%2C
-
Geng, Guannan, et al. “Impact of China’s air pollution prevention and control action plan on PM 2.5 chemical composition over eastern China.” Science China Earth Sciences 62.12 (2019): 1872-1884.
-
Zhao, Shuqing, et al. “Ecological consequences of rapid urban expansion: Shanghai, China.” Frontiers in Ecology and the Environment 4.7 (2006): 341-346.


![The Statistics of Biodiversity Loss [2020 WWF Report]](https://u4d2z7k9.rocketcdn.me/wp-content/uploads/2020/12/lprwinkyTHB-544x306.jpg)


