


The advent of satellite technology has allowed us to monitor the state of the cryosphere for four decades. It has become clear that both Arctic glaciers and sea ice are dwindling proportionally to atmospheric warming, disrupting a 12,000 year equilibrium.
—

Source: NSIDC.
The arctic has warmed well over twice the average global pace, resulting in more sea ice melt than expected. There are a few ways to measure this, but the main method is by monitoring sea ice extent, or the oceanic area with at least 15% ice cover. Sea Ice extent hit record lows in summer 2012, summer 2019 being the runner-up. The 13 worst years for Arctic sea ice came in the last 13 years, and in 2021, its summer extent was 7.4% lower than the historical average.

Source: NSIDC.
What it means
Losing ice has multiple side-effects. The first and most obvious is sea level rise, which has been accelerating and could reach 1 to 2 meters by the end of the century. Second, white surfaces help reflect sunlight into space and keep the planet cool, so ice loss increases warming, creating a feedback loop. Darker waters in the Arctic also absorb more heat. Scientists expect ice free summers could arise as early as 2035 as the system tips toward runaway melt.
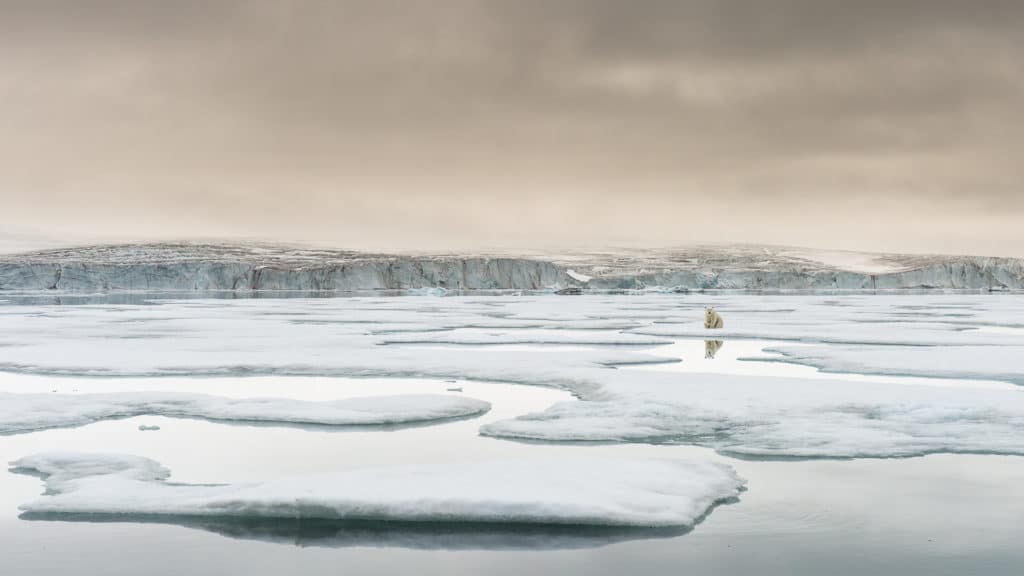
As sea ice disappears, nations prepare to capitalize on new shipping routes, fishing zones, fossil fuel exploration and military activity in northern waters. However, as this develops, walruses and polar bears will lose their habitats, and the warm-weather jetstream will weaken, potentially altering European weather for centuries to come.
This article was written by Owen Mulhern.
You might also like: The Keeling Curve Explained


![The Statistics of Biodiversity Loss [2020 WWF Report]](https://earth.org/wp-content/uploads/2020/12/lprwinkyTHB-544x306.jpg)


