Sign Up
  • Earth.Org Newsletters

    Sign up to our weekly and monthly, easy-to-digest recap of climate news from around the world.

  • This field is for validation purposes and should be left unchanged.
Earth.Org PAST · PRESENT · FUTURE
Environmental News, Data Analysis, Research & Policy Solutions. Read Our Mission Statement

World hunger, after nearly two decades of abatement, is back on the rise, now affecting 663 million women, men and children according to the UN Food and Agriculture Organization (FAO). It also announced in 2011 that one-third of global food production is wasted. Here, we give you an overview of the most important, but also recently updated food waste statistics so you can educate yourself and those around you. 

Food waste has no place in our world. Millions are undernourished in low-income nations while overproduction drops prices in those of high-income, painting an overall nonsensical picture. We need to address this admittedly multi-faceted issue out of responsibility, and the first step in doing so is to understand it. 

Its rise to concern was solidified by its inclusion in the Sustainable Development Goals in 2015, setting the target to halve per capita post-retail global food loss by 2030. A good start, but far from enough. A McKinsey report from November this year shows that only half of the lost food happens at or after retail, and that the farming stage is worth paying more attention to. 

food waste statistics

Till now, farms were somewhat overlooked because of the idea that it was a lower-income country problem, mainly due to poorer harvest and storage technology. The truth is that waste at the farm stage can be driven by the socio-economic and market factors that shape the agricultural system. Farmers need to match demand as best they can, but there are currently no (or very few) systems set up to give them the information. In wealthy nations, they will understandably overproduce rather than the opposite, but this drives down prices and damages the environment

The WWF’s latest report comes with a timely update on food waste statistics. According to them, farm-stage food waste is actually higher in high-income countries, whose 37% share of the global population contributes 58% of global harvest waste. Further, they report 1.2 billion tonnes of farm-stage food waste per year. This is far more than previously thought and pushes the share of wasted food up to about 40%. 

It doesn’t end there. If waste in the face of the millions going hungry wasn’t enough, food waste is also a major contributor to climate change and environmental damage. Farm-stage food waste amounts to 2.2 gigatonnes of CO2eq a year, that is 4% of global anthropogenic emissions, while food waste overall, 6-8%. 

It just so happens that food production in general is the biggest driver of land use change, and therefore habitat loss, something we know is bad but not exactly how bad. We urgently need to optimize the system both in terms of production and distribution to curtail the entirely avoidable waste and suffering we have today. 

How do we do that? 

Governmental bodies need to check their definitions, which so far have left certain stages of food loss out of consideration. Next, pre- and post-retail food waste should be of equal concern, and then new goals should be defined. 

The best thing the average person can do is be less picky about the way food looks. Seriously. 

Finally, the Internet of Things and artificial intelligence are tools with incredible potential that should help us optimize every stage of the process. This means less and better use of farm resources and better predictions of the type and quantity of demand. However, techno-optimism is risky, so we should do our best to solve the problem as best we can now.

This article was written by Owen Mulhern

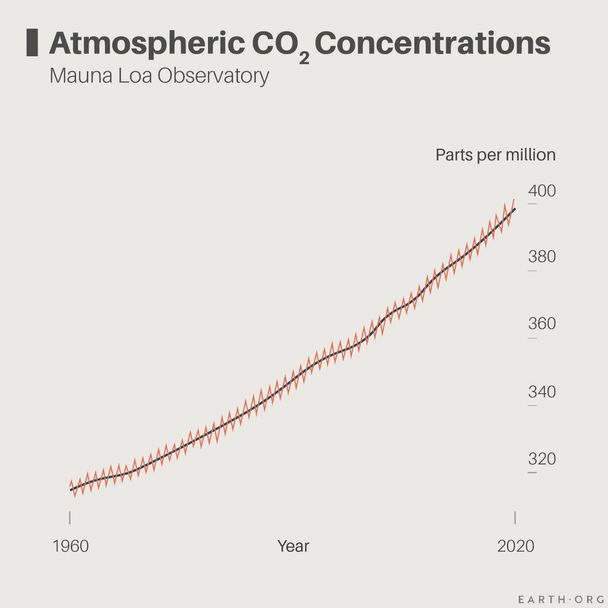
You might also like: The Keeling Curve Explained

The Keeling Curve is a graph of the longest uninterrupted record of atmospheric CO2 levels on Earth. The data comes from the work of Charles David Keeling of the Scripps Institution of Oceanography, who managed sampling efforts at Mauna Loa, Hawaii, between 1958 and 1964. 

keeling curve

Why is it important?

First, it is one of the most recognized successful examples of a long-term study, giving it academic value. But beyond this, it is the connection between modern CO2 concentrations and those of the past, and here is why.

We were able to measure CO2 (and other atmospheric molecule) concentrations as far back as 800,000 years ago thanks to air bubbles trapped in deep layers of very old ice at the poles. Keeling instead used direct sampling with what is now called Keeling flasks. Surprisingly, they are still in use today: “Hold your breath and walk into the wind, then open the valve,” says Tim Lueker, a researcher in the CO2 Research Group at Scripps Institution of Oceanography, UC San Diego.

The Keeling curve also came at a turning point when atmospheric CO2 concentrations, stable for centuries, suddenly began their rapid increase from ~280 ppm to the present 411 ppm. It is part of a small collection of studies that provided early signs of climate change’s emergence.


The Keeling Curve Pattern

The Keeling curve is defined by its choppy, repetitive pattern, one of two found by Keeling and his colleagues. 

As their study progressed, Keeling and his team began to notice patterns. CO2 levels were higher at night than during the day, which he attributed to plant photosynthetic activity. Over the course of a few years, they noticed an even larger scale pattern: CO2 levels are highest in the Spring, and lowest in Fall, or vice-versa in the northern hemisphere. There are far more plants in the north than in the south, so CO2 consumption peaks during Spring leafing and drops in Fall dormancy. 

The world now looks to the Keeling curve as the main reference for global atmospheric CO2 levels. It has gone from a warning to a record-keeping tool that we will be able to look at with pride when we will have cut emissions enough to slow or even stop the curve’s upward slope.

This article was written by Owen Mulhern.

You might also like: The 9 Biggest Fast Fashion Statistics

Wealthy nations are far behind schedule on a promise to reach $100 billion worth of climate financial aid for developing nations by 2020. Earth.Org takes a closer look.

There will be many things to cover at Glasgow’s COP26 summit, but one of the biggest may be a conspicuously broken promise. 

The pledge was made at COP15, 12 years ago in Copenhagen. Countries agreed for the world’s wealthiest countries to raise $100 billion per year by 2020 to help developing countries adapt to climate change. 

$100 billion climate aid pledge broken promise

Funds have been distributed each year, meant to progressively increase to reach the wset target, but this never happened. Figures for 2020 are not yet in, but it is clear that neither last nor this year will see the promise kept. 

The issue is an important one for the upcoming COP26, partly because of its relative insignificance. The adaptation cost of climate change will be in the trillions per year, dwarfing the $100 billion that should be easy to gather up. As Saleemul Huq, director of the International Centre for Climate Change and Development in Dhaka put it, “the $100 billion is iconic in terms of the good faith of the countries that promised it,” nothing more. 

Or nothing less. A successful transition to sustainability relies on enough nations doing the right thing without legal binding. Cases of missed targets and dishonored pledges can create an atmosphere of distrust that could hamper any progress the COP summits are meant to foster.

To make things worse, it was revealed by the charity Oxfam that the OECD’s estimates of climate finance were vastly overestimated. While the official numbers claim $70 billion to $80 billion were distributed each year in 2017-18, Oxfam found that the real number was only between $19 billion and $22 billion. It explains that the full value of loans shouldn’t be counted, leaving only grants and the benefit accrued from low-interest lending. Some countries, such as Japan, count the full value of aid projects that don’t exclusively target climate action, further skewing the results. 

$100 billion pledge missed, past donations have been overestimated according to Oxfam

Fair Share

Although rich nations agreed to the $100 billion goal, it wasn’t formally spelled out what each would pay. Calculations of fair shares take either wealth, past emissions, population or a combination of these metrics into account. All combinations agree: the United States has come up short.

According to the WRI, it should contribute 40-47% of the $100 billion, but instead, it gave an average $7.6 billion between 2016 and 2018. Japan and France gave more than their fair share but most of it came from loans. 

fair share oof contribution to climate finance


Where Is the Money Going? 

An overwhelming majority of the funds is going toward carbon emission mitigation where success metrics are clear, as opposed to adaptation efforts that can be harder to assess. As of now, only $20 million a year goes toward adaptation, though the OECD estimates that developing countries already need $70 billion and will need between $140 billion and $300 billion by 2030. 

Far more concerning is that climate aid is not equally distributed. Most of it has gone to middle-income countries, while the poorest, most vulnerable are left behind due to an inability to jump through the complex hoops to access the funds. The International Institute for Environment and Development in London reported that it could only track 20% of what little had been dedicated to the poorest countries between 2014 and 2018, 

What Now?  

Wealthy countries reaffirmed their commitment to the annual $100 billion contribution at the G7 summit in June, with new pledges by Japan, Germany and Canada. Now, in the months preceding COP26, the EU pledged $5 billion more annually by 2027, while the US promised an extra $11.4 billion by 2024. That would make it the largest contributor in absolute terms, but behind most in fair share. 

Yet, the progress is welcome, and economists believe the $100 billion target will be reached in 2022. Talks of a post-2025 target will be broached at COP26 and though a final decision is unlikely to happen so early, a figure of $750 billion a year by 2030 has been mentioned. 

How Much Is Enough? 

According to the Climate Policy Initiative, a non-profit based in San Francisco, California, estimates that climate-related finances totaled $632 billion in 2019-20. That’s a far cry from the $1.6 – $3.8 trillion required to stay below 1.5C. Meanwhile, fossil fuels still receive $554 billion in subsidies (by one estimate), as noted by Jocelyn Timperley from Nature. To put things in perspective, global military spending was $2 trillion in 2020. 

The challenge now is to overcome the monkey wrench COVID-19 put into the world’s plans two years ago and attempt to get all nations on the same page. It is, after all, everyone’s fight.

This article was written by Owen Mulhern. Cover photo by Andrew Petrov on Unsplash.

You might also like: Climate Finance: Are the Rich Nations Doing Enough?

A comprehensive report on the state of the world’s coral reefs was recently released, so we at Earth.Org mapped it out to give you a lay of the land.

The Global Coral Reef Monitoring Network (GCRMN), established in 1995, has undertaken the task of informing the world on the state of its coral reefs.

To say these ecosystems are invaluable is far from an overstatement – despite covering only 2% of the ocean area, they house 25% of its species. Naturally, many human societies have settled around these bountiful areas, which also protect coasts from erosion and slow storm surges. 

They are now under significant pressure from human activities, and though they show resilience, how much exactly remains to be seen. The GCRMN’s latest report, published in September 2021, reaches as far back as 1978 to better understand how corals are reacting to human pressure. 

hard coral reef cover

At first high and stable, a mass bleaching event occurred in 1998, decreasing global hard coral cover by 32.5%. Corals recovered to a very healthy level by 2009, but respite was short-lived because 8 years of decline ensued, with a slight upward tick to cap off a decade of loss by 2019.

Some of the most damaging practices to vibrant ocean-floor ecosystems is direct bludgeoning by coastal development, dredging, quarrying, and bottom trawling. This last one consists in dragging multi-ton blocks along, which pull a huge net behind them. As you can imagine, the technique is frighteningly effective, yielding more catch by weight than any other method each year. 

Regulation and enforcement is a simple solution for the above, but a range of other issues plague our reefs. Pathogens and toxins from poorly recycled sewage water inexorably accumulate in the ocean and poison coastal lifeforms first, while micro-plastics and other forms of trash have become pervasive on our planet. 

Acts as simple as overfishing can be too much for a reef’s ecosystem to bear, increasing its vulnerability and chance of collapse. 

Policy-makers need a lay of the land if they are to take effective action, and this is where the GCRMN’s hard-gathered data comes in. 

coral reefs reef global map

We’ve highlighted the 5 most coral-rich regions of the world, which contain over 80% of the total, along with the losses they’ve sustained overall. 

The optimists among you may have noticed that coral reefs can regenerate – a fortunate and encouraging fact. However, the GCRMN’s survey found that within 8 of 10 regions, some corals were never fully able to recover, suggesting an imminent limit to reef resilience. 

It is incumbent on few rather than many to legislate for coral protection. However, this is less likely to happen in developing countries where short-term priorities trump the long-term. 

This article was written by Owen Mulhern. 

You might also like: Climate Change is Shifting Crops

As climate change slowly transforms the world’s weather, so does the suitability range of crops. There are big questions surrounding the future of food, including how we will feed over 9 billion people by the end of the century, so we take a look at a facet of the problem here. 

When carbon dioxide’s atmospheric warming properties were first discovered in Sweden in 1896, it was broadly seen as a good thing. Why not? Sweden is a cold country, and a little extra warmth could benefit both the people’s mood and their agriculture. 

Over a century later, we are sitting in the midst of a rapidly changing climate whose warming has a myriad of knock-on effects. While it is clear that the overall effect is negative, especially for those in harsh, under-developed countries, some consequences might be more nuanced.

Crops in particular are a hot topic. Many studies have looked at the adverse effects of climate change on crop yields, but according to Lindsey Sloat, a researcher at the Department of Ecosystem Science and Sustainability at Colorado State University, they overlooked an important factor. Crops will suffer in their current layout, but suitability will actually shift. 

What does this mean? This means that climate-induced losses can be mitigated and even overcome by migrating our crops to newly suitable areas. Crop migration is already in full swing; some areas of Sicily, Italy have become too hot for their perennial grapevines, pushing farmers to grow more exotic fruit like avocado and passion fruit

Unfortunately, physically moving to follow a particular plant’s growing range isn’t realistic in today’s world. Farmers will therefore be limited to a new selection of crops once conditions have changed, regardless of local demand, resources and endemic plant diseases.

Lee Hannah and a team of researchers from Conservation International, Virginia, USA, modelled the extent of climate-shifted agricultural frontiers in a high emissions scenario. 

crop range future crops climate change

These new frontiers are equivalent to over 30% of the current agricultural land on earth. Investing in them would mean a massive disturbance of biodiversity, water resources and ground carbon. 

Watersheds serving over 1.8 billion people would be affected, diverted for irrigation or contaminated with fertilizers and pesticides. The scale of change induced by climate change is huge, and the cost of adaptation just as daunting. 

We’ve been hearing about climate change more than ever in the past two decades, but the science often remains murky, and headlines become more difficult to trust by the day. Here, we outline in simple terms what climate change is, and what you can expect for the future.

First, simply put, climate is the long-term pattern of weather in a particular area. There can be many day-to-day, week-to-week, month-to-month and even yearly changes, so the climate is derived from at least 30 years of observation according to the National Geographic Society.

Climate change is the long-term change in the observed patterns, meaning variations go beyond those previously observed. 

When we use the word climate change, we actually refer to two things: global warming driven by human greenhouse gas emissions and the resulting knock-on effects. These are myriad and still difficult to predict, but some include increased drought and flooding, sea level rise, intolerable heat waves and many more. 

The largest driver of global warming is the emission of gases that trap heat in what is called the greenhouse effect, hence the term greenhouse gas. 

global warming climate change infographic

These emissions come from both natural sources (e.g. decomposition or volcanoes), and human sources (mainly fossil fuel combustion). We’ve ramped up our use of coal, oil and more recently natural gas over the last 2 centuries to meet our rocketing energy requirements. While we now have cleaner energy alternatives than we used to, global emissions remain at an all-time high. 

The International Panel on Climate Change (IPCC), the “United Nations body for assessing the science related to climate change”, released its latest report this year, stating that humans have unequivocally warmed the atmosphere, ocean and land. 

climate change facts temperature at its highest in 125,000 years

Source: IPCC AR6 (2021).

In the figure above, we see to the left in panel a) the reconstructed average global temperature over the past 2000 years. Temperatures today put us at the hottest time in over 100,000 years. To the right, we see two simulations of future temperature: one with only natural causes (in green) and one with human causes included (brown). The latter matches real-world observations (black line) nearly perfectly. 

Of course, scientific evidence does not take us past denial, as demonstrated by the reticence toward wearing masks or taking vaccines throughout COVID-19. However, it does provide powerful arguments for policy-makers and lawsuits pushing for change. 

The Current State of Climate Change

So far, the world has warmed by an average 1.1C compared to pre-industrial times. This can often be misleading because it may not seem like much, but it is actually a lot. 

We need to think about extremes, as in temperatures, and weather events that are unlikely, and often dangerous. 

Climate change temperature probability distribution

Source: Shell Climate Change

A small increase in average temperatures can mean that what used to be extreme heat can become more of a summer norm, while the new extremes hit harder than ever before. 

To illustrate how impactful high temperatures can be, here is an interesting piece of data provided by The Lancet.

workk hours lost to heat climate change facts

The number of work hours lost to heat has increased from 199 to 302.4 billion hours a year since 2000.

Another huge consequence of climate change is the change in rain patterns. The atmosphere can hold 7% more water for each degree it warms, and the result is quicker accumulation of rain clouds and heavier downpours. This means more floods where it does rain, and more drought where it doesn’t. 

population exposed to drought in 1.5 vs 2C warming

Other problems like wildfires, hurricanes and storms are being exacerbated by the changes in rainfall patterns, and even these can have knock-on effects. As an example, when wildfires decimate forests, tree roots stop holding the ground in place and rockslides become more likely. 

This isn’t theoretical anymore. Climate change is already affecting every inhabited part of the globe in a variety of ways.

Climate change observed change

Observed changes in hot extremes and drought around the world, varying degrees of certainty. Source: IPCC AR6.


What we can expect for the future

The IPCC report makes one thing clear. The warmer we let it get, the worse things will be. While it may be too late to prevent climate change altogether, it is definitely worth limiting it. 

We are currently on track for around 3C global warming by the end of the century, after which the temperature should stabilize (this is called equilibrium). Were this to happen, sea level rise would continue for decades to centuries, and other systems might similarly continue to deteriorate.

An important concept for the future is that of a tipping point. This is when an ecological system is pushed to the brink, and begins its irreversible transformation into something else. For instance, the Amazon rainforest has currently lost between 15 and 17% of its area. If it loses enough, it will begin turning into a dry, shrubby savannah with only a fraction of the biodiversity and natural bounty it provides us with now (not to mention the billions of tons of carbon it would release). The only problem is, we don’t know how much deforestation will tip it over the edge. Our researchers’ best estimate is between 20 and 40% deforestation, leaving us with much uncertainty. 

amazon deforestation

Source: Conrado da Cruz et al. 2020.

Another crucial tipping point is that of Antarctica. It contains enough water to increase sea levels by ~60 meters, which would submerge nearly every coast in the world. The continent’s melt rate has increased, and icebergs 4 times the size of London have been observed breaking off. Past a certain amount of melt, it could become committed to losing much more ice, no matter the temperature.

What we’ve described so far only covers a fraction of the consequences of climate change, yet we are having difficulty as a civilization to address it. The truth is that most of us won’t experience ostentatious manifestations of climate change until things get really bad. The average person in town won’t see the crop failure that got replaced by imports, nor the drought afflicting a faraway country. 

Sadly, lower-income countries are far more vulnerable to climate change despite having contributed virtually nothing compared to higher income countries.


poorer countries are more vulnerable to climate change

One of the biggest barriers to our ability to deal with climate change is the timeframe. Most politicians and businessmen operate with a 2 to 5-year mindset, but what is optimal for the short-term is proving detrimental to the long-term. A shift is needed, though how to induce it remains to be seen. 

So, what is climate change? Climate change is one of the most complex, multi-dimensional problems humanity has faced. It tests our cohesiveness as a global society, and our ability to think long-term rather than focus on the now. It might cost us, but it might also teach us.

This article was written by Owen Mulhern.

You might also like: What Is Blue Carbon Worth to You?

On a local level, coastal ecosystems provide healthy fisheries, cleaner oceans and erosion-resistant shorelines. On a global scale, their services consist of sequestering carbon at incredibly high rates, forming stores that we refer to as Blue Carbon. 

The main sinks are mangroves, tidal (or salt) marshes and seagrass meadows, found on every continent except Antarctica and covering only 2% of all oceanic area. Despite their scarcity, they are crucial components of the biosphere, and unfortunately, they are disappearing fast. 


blue carbon ocean ecosystems carbon sinks

As you may suspect, human activities like fish farming are the main driver behind these losses. 

A mangrove-focused 2020 NASA study reported that 62% of the damage is anthropogenic while the rest comes from natural causes. Of course, natural damage driven and exacerbated by  climate change can be indirectly linked to humans. 

While pressure has been declining overall, human causes more so than natural ones, increasing the latter’s importance in future conservation efforts.

mangroves natural and human driven losses

Source: NASA.

Similarly, seagrass declines can be attributed to human activities like coastal development, and declining water quality, while tidal marshes find themselves drained and dry due to our tidal restrictions. 

We often build dikes, tidal gates and impoundments around waterways near settlements, which stops water influxes towards surrounding reservoirs like these marshes. The result is the loss of natural drains during floods and biodiversity loss. 


Valuing Nature

The range of services that coastal ecosystems provide undoubtedly have economic value to us, though it can be difficult to measure them holistically. 

However, if we focus on carbon sequestration, there are tools at our disposal to put a price on Blue Carbon absorption around the world. 

The social cost of a ton of carbon, or how much each ton of carbon will end up costing our economy, was tagged at US$37 dollars by the UN. A team of researchers from the Kiel Institute for the World Economy used this to estimate the value of coastal ecosystems’ yearly carbon storage. 

According to their results, the answer is between US$160 and US$220 billion a year.

We mentioned that blue carbon is found all around the world, but some countries hold far more than others.

blue carbon map carbon sinks

Much like the world’s rainforests, or remaining untouched wilderness, stewardship of these invaluable resources falls onto few. We’ve seen what can happen when the wrong person is elected to office with Jair Bolsonaro, under whom Amazon deforestation rose again after a decade of progress. 

Putting a concrete price tag on Blue Carbon is huge for conservation – its proponents will now be able to make concrete cost-benefit analyses to push for protective measures. This may not always lead to enough votes within the government, but it does provide hard evidence in court. 

There are other examples of conservation litigation around the world, like those against wildlife destruction in Indonesia and the Democratic Republic of the Congo, but these suffer from a lack of robust science and figures. 

Blue Carbon pricing is an example of how research is helping build a giant case against environmental destruction. Whether or not this will happen fast enough to avoid catastrophe remains to be seen. 


This article was written by Owen Mulhern. Cover photo by Benjamin L. Jones on Unsplash.

You might also like: 11 Interesting Facts About Climate Change


Recent research has found that the magnitude of ice melt is causing the Earth’s crust to move as a result of the weight lost. 

In case you missed it, we lost about 28 trillion tons of ice between 1994 and 2017, and it is now melting at a rate of 1.2 trillion tons a year. 

That’s more than the weight of all living things on earth. Each year. In fact, it’s enough that the Earth’s crust is moving, both vertically and horizontally as a result. 

This is a phenomenon known as post-glacial or crustal rebound, where land masses free of the huge weight of ice sheets are pushed back up by the viscoelastic mantle that underlies them. 

These movements have been considered over glaciated areas in the past, but Sophie Coulson and her team at Harvard University computed and mapped post-glacial rebound’s more far-reaching effects. According to their results, ice melting from Greenland and Arctic glaciers caused the ground to shift horizontally across much of the Northern Hemisphere, up to 3cm per decade in Europe, Canada and the US.

ice melt crust movement

Source: Coulson et al. (2021).

The color coding indicates vertical rather than horizontal motion, which you can see has been distinctly stronger around Greenland. Though the rate of vertical motion is quite low (~1 cm per decade), we are speaking of masses beyond human understanding; a tectonic plate’s weight is of the order of 40 sextillion kilograms. 

The fact that there has been enough ice melt to make the earth’s crust move should give us a better appreciation of how much ice we are losing due to climate change.


This article was written by Owen Mulhern. Cover photo by jesse orrico on Unsplash.


You might also like: Mapping the Most Polluted Cities in the World

Until recently, it was estimated air pollution killed ~7 million people a year, but a study re-evaluated it to 10 million. This means air pollution surpasses cancer as the second-worst cause of death after heart disease. Here, we go over the 15 most polluted cities in the world, most of which are found in two countries.

According to IQAIR, these are the 15 most polluted cities in the world as of August 2021.

iqair most polluted cities in the world

IQAIR most polluted cities, August 26th 2021.

To help you put these levels of pollution into perspective, we mapped a few of these cities using Berkeley Earth’s air pollution to cigarette equivalence. It translates fine particulate matter (PM2.5) concentrations into the amount of cigarettes smoked that would produce the same health risks.

  • Bhulandshahr

Bhulandshahr is satellite city of Delhi, suffering from heavy vehicular pollution, poorly regulated industrial activity, dust from construction sites, and compounding meteorological conditions, making it the second most polluted city in India. 


Bulandshahr most polluted cities in the world


  • Noida and Greater Noida

6th of the most polluted cities in the world is Noida, a satellite city of Delhi, which suffers its worst spells of air pollution during the months of September through December. Farmers burn the stubble off of their crops in order to quickly make way for the next round, and emissions usually linger due to seasonal weather patterns. This unfortunate combination makes Noida one of the most polluted cities in the world. 

Greater Noida is one of India’s planned cities located in the suburban district of Gautam Budh Naghar in Uttar Pradesh. It was built as an extension of the Noida area and to relieve the demographic burden in Delhi, housing many of India’s largest industrial plants and residential properties. This rapid urban development produced the highest levels of dust and particulate pollution in recorded history. 

Greater Noida most polluted cities in the world
  • Kanpur

Kanpur, a metropolitan city in the state of Uttar Pradesh, is the birthplace to some of the world’s largest leather manufacturers. The large number of leather tanneries, coupled with vehicle emissions and an abundance of coal-burning facilities, produces one of the world’s most toxic cases of airborne pollution.

Kanpur most polluted cities in the world


  1. Lucknow

Lucknow is the capital of the most populous state in India, Uttar Pradesh. The city has a humid, subtropical climate that slows down the dispersion of pollutants from the air. It also suffers from unchecked vehicular and construction site pollution, along with cases of illegal refuse incineration. 

lucknow most polluted cities in the world
  1. Delhi

Delhi is the capital city of India with a population of over 18 million. Among many of the cities in India, Delhi suffers from some of the highest cases of particulate matter concentration in the world. The prominence of new small-scale industries including brick kilns and diesel generators have adversely affected millions who have been exposed to the toxic smog for extended periods of time. 

Delhi New Delhi most polluted cities in the world


India and China’s overwhelming presence in this list does not come as a surprise. As the two most populous and rapidly developing industrial powers in the world, pollution is unavoidable. They’ve both improved in this area in recent years, but some areas remain outright dangerous to live in, and policy is moving sluggishly. 

A commonality between these two countries is that both have centralized governments with little authority assigned over to state and local governments. The latter are more likely to try to improve their constituents’ quality of life, while the former seems to prioritize country-wide economic growth over quality of life.

Indeed, this is what it boils down to – is the government ready to sacrifice financial development for environmental and human health? 

It is difficult to point fingers when every developed nation today went through a phase of heavy pollution and environmental degradation before toning it down. Of course, they only did so once they were fully developed, and some are still far from role models. 

China and India are still heavily reliant on coal, the main driver behind air pollution since the industrial revolution, and until this changes, air quality will remain a problem. Moreover, sheer population size leads to the formation of megalopolises, which, combined with poor meteorological conditions inevitably create poor atmospheric conditions. 

Does this mean the governments aren’t at fault at all? Not quite. While China has made great progress on this front, regulatory policy has been intentionally slow, putting development first. What policy there is is further hampered by corruption, still rampant in India today though less so in China. 

In the northern Indian state of Haryana, industrialists paid off officials to learn information about surprise raids by the State Pollution Control Board (SPCB). The irrigation systems in India are substandard because of contractors desiring lower costs, and village elites bribe forestry officials for harvests well beyond regulated amounts, which increases problems like deforestation and stubble burning.

While both these countries have a valid argument in saying development goes hand in hand with pollution, over a million die from air pollution each year in both countries. They have the option of not reproducing other countries’ mistakes, while also doing what is right by their people. 

This article was written by Austin Gigi and Owen Mulhern. 

You might also like: What is the Tragedy of the Commons?


It is common knowledge today that excessive greenhouse gas emissions have been warming our atmosphere at driving climate change. Scientists, activists and politicians are calling for a stop to these emissions, but is that really enough? What would happen if we stopped using fossil fuels today?

The International Panel on Climate Change just recently released its sixth Assessment Report. What they found was an overwhelming amount of data on the present and potential effects of human-induced climate change on the earth. But if we got ourselves in this mess, is it likely that we can do enough to reverse the damage we’ve inflicted? Or is there no returning to sustainable conditions?

Greenhouse gases. Gases that allow life to thrive on earth by sheltering and providing warmth, just like a greenhouse. The gases—carbon dioxide, methane, nitrous oxide, fluorinated gases, etc.—trap solar radiation within the earth’s atmosphere, making the earth warm enough for the habitation of all sorts of life. This process is known as the greenhouse effect.

fossil fuel greenhouse gas emissions global

A pie chart showing the percentages of different greenhouse gases in the atmosphere. Source: US Environmental Protection Agency

The greenhouse effect and greenhouse gas narrative is a necessary evil. Earth’s average temperature without the greenhouse effect would be as cold as -18ºC, a staggering 30ºC lower than our current average temperature. But too much of anything can have severe effects, and the same goes with greenhouse gases. To understand how to mitigate our greenhouse gas emissions, we must first understand the beginning of the spike in emissions around 2 centuries ago.

The beginning of industrialisation saw copious amounts of greenhouse gases being pumped into the atmosphere, what with the discovery of cheap energy such as fossil fuels. The efficiency of using cheap energy in industrial processes triggered trends of mass production and consumption, leading the emissions rate to snowball and increase exponentially. Since the first industrial revolution in the 1760s, 375 billion tonnes of carbon dioxide alone have been emitted around the world, and that’s disregarding the other more potent greenhouse gases like methane and nitrous oxide.

carbon dioxide and future temeprature rise linear relationship

Source: IPCC AR6

The graph above demonstrates a near-linear relationship between cumulative CO2 emissions and the increase in global surface temperature. “Each 1000 GtCO2 (billion tonnes) of cumulative CO2 emissions is assessed to likely cause a 0.27°C to 0.63°C increase in global surface temperature with a best estimate of 0.45°C”, the IPCC report states. Their tight correlation is highly suggestive of the fact that increasing anthropogenic greenhouse gas emission is going to cause mass changes in the weather patterns, habitation, and biodiversity. But if we stopped using fossil fuels today, would that stop temperature rise too? Or are we perennially stranded in these already dire conditions?

It is important that a distinction is made between stopping greenhouse gas emissions and reducing emissions to net-zero. What would happen if we just stopped producing carbon dioxide, the prevailing greenhouse gas, but made no effort to remove it from the atmosphere? As carbon sinks, our lands and oceans would absorb some of the CO2 in the atmosphere, thus reducing atmospheric temperatures over time. However, the CO2 left un-absorbed by the sinks would linger in the atmosphere for around 300-1000 years. As for the ocean, it would likely continue to warm until it reached the same temperature as the atmosphere, which would bring the earth back into radiative equilibrium. Radiative equilibrium refers to a scenario where incoming solar energy is balanced by an equal amount of energy being radiated back into space. At this point, global temperature is the most stable it can be. Studies predict that reaching radiative equilibrium (after stopping carbon emissions) would call for around 0.5ºC of further warming.

In a best-case scenario where we manage to reduce carbon emissions to net-zero, it was originally thought that temperatures would stay relatively constant. However, the recent IPCC report found that sustained net-zero carbon emissions would reverse the increase in surface temperature and potentially reverse surface ocean-acidification. It would not, however, interrupt the trajectory of other climate-change-induced phenomena such as sea level rise, expected to continue for decades to millennia.

The graph below, made by the folks at Carbon Brief, illustrates future warming under different scenarios. 

if we stopped using fossil fuels and other scenarios

A graph showing the trajectory of temperature increases in different zero-emissions scenarios. Source: Carbon Brief


While we focus on CO2 with good reason (its concentration makes it the main driver of global warming by far), other greenhouse gases are not to be underestimated. Methane, second in concentration to CO2, is also 28 times more potent, but has a lifespan of only 12-13 years. Vast amounts of methane are stored under frozen ground in the Arctic, and rising temperatures threaten to release it. Conversely, nitrous oxides mainly come from human activities, and while they persist for around 120 years and represent only 6% of emissions in the US, their heat-trapping ability is 250-300 times greater than CO2. 

Although some greenhouse gases last for shorter periods in the atmosphere, we cannot afford to play the waiting game. With the effects of anthropogenic climate change becoming increasingly impactful, it is clear that reversing them is largely preferable to stalling them. If we stopped using fossil fuels today, warming would certainly slow, but greenhouse gas removal from the atmosphere will need to happen eventually.

This article was written by Alexandria Pu.

You might also like: 11 Interesting Facts About Climate Change.

Subscribe to our newsletters

The best environmental stories of the week and month, handpicked by our Editor. Make sure you're on top of what's new in the climate.

SUBSCRIBE
Instagram @earthorg Follow Us