Sign Up
Earth.Org Newsletters

Sign up to our weekly easy-to-digest recap of climate news from around the world.

Earth.Org PAST · PRESENT · FUTURE

Located on the west bank of the Guayas River, Guayaquil is the second-largest city in Ecuador. Its 3 million inhabitants are no strangers to natural disasters, as earthquakes and floods are a constant threat. It is ranked 4th on the list of cities most vulnerable to sea level rise, and Earth.Org has mapped flooding by 2100 to illustrate why. 

—

Located in the Guayaquil flooded grasslands, the eponymous city is dry for the most part, except during the months of January to April when it experiences heavy rainfall. The wetlands have been reclaimed for agriculture to the point of critically endangering the ecosystem. 

The Guayas River is tidal, meaning its level fluctuates with that of the sea. The lack of natural drainage from filling the surrounding wetlands, combined with the intense rainy season, makes flooding a common ailment for the citizens of Guayaquil. 

Well aware of the risks, the community runs emergency drills and monitors sea levels closely, but if these reach 1 to 2 meters, as they are expected to by the end of the century, there won’t be many affordable solutions available. Earth.Org has modelled the flooding Guayaquil could experience by 2100, as a call for awareness.
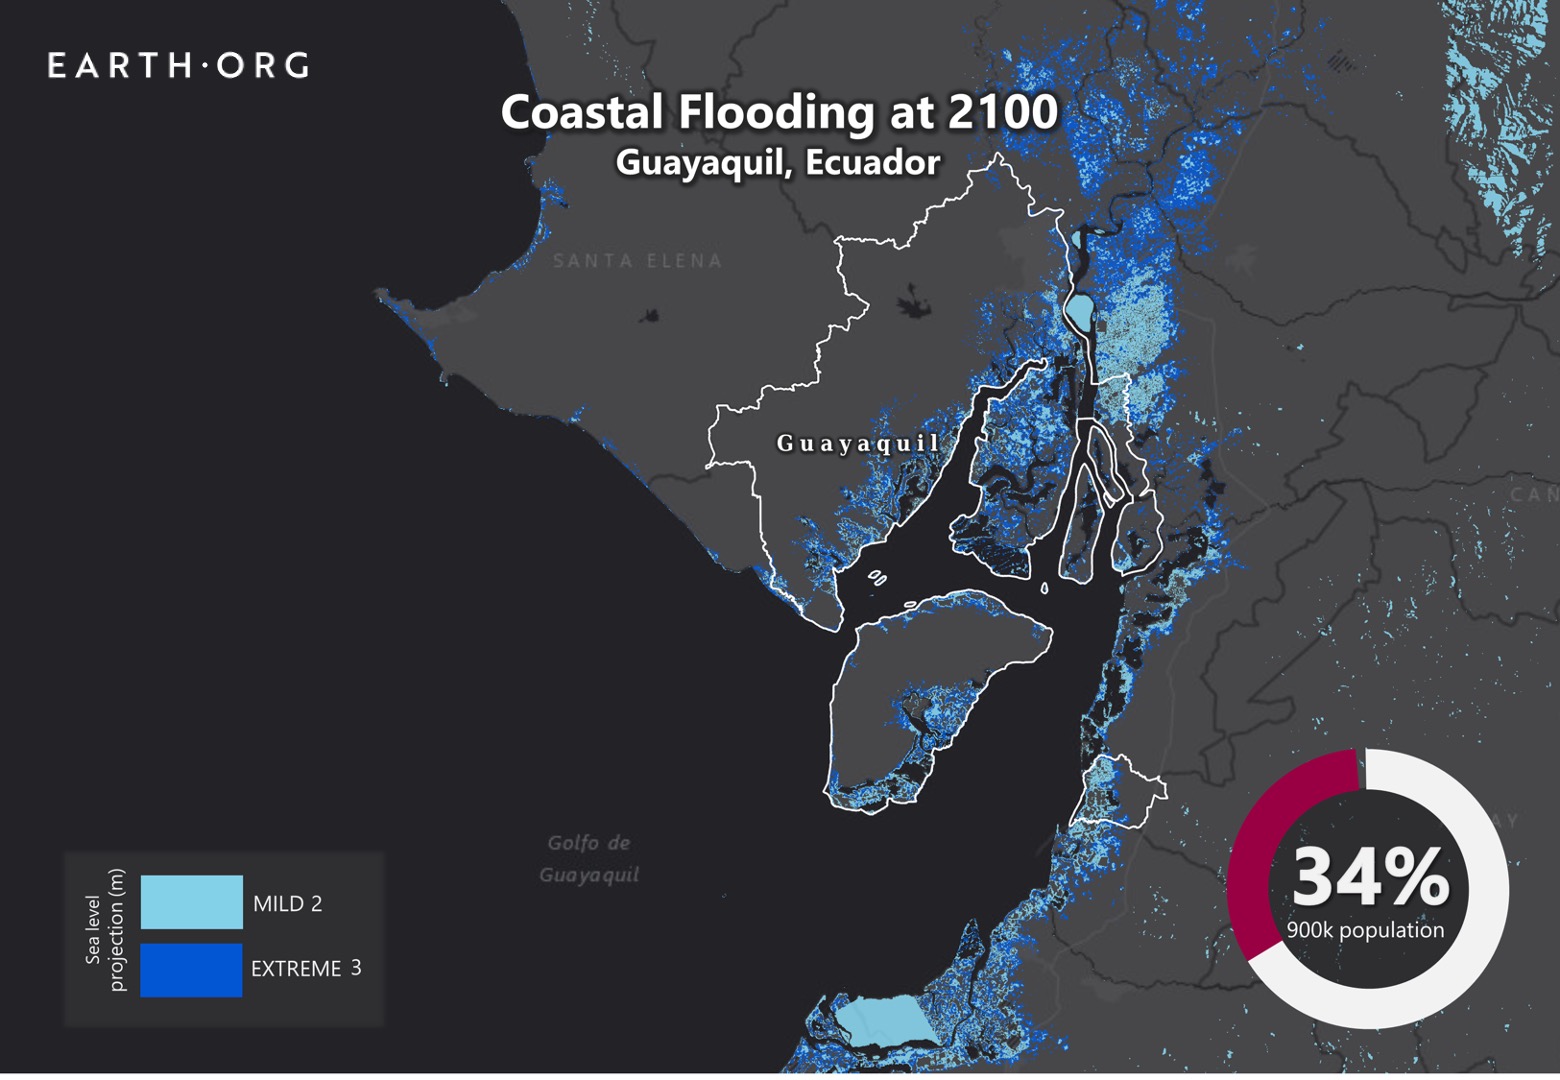
sea level rise by 2100 guayaquil

Sea level rise projections by 2100 for two scenarios with the amount of rise in meters indicated (mild = 2m; extreme = 3m). Percentage and total population displacement indicated bottom right.

Methodology

Global mean sea level is projected to rise by 2m at the end of this century. However, in order to determine local sea level rise (SLR), one has to take into account local coastal flood levels which could be 2.8m above Mean Higher-High Water (MHHW) at extreme forecasts. These local levels bring variability to the projected SLR from 1m to 6.5m (eg. Rio vs Kolkata).

The SLR scenarios used in this study are based on the forecasts from Climate Central – Coastal Risk Screening Tool  with the following parameters:

  • Sea level Projection Source
  • Coastal Flood Level
  • Pollution Scenario
  • Luck

Sea level Projection Source:

From two highly cited journals by Kopp et al., estimating SLR mainly due to ocean thermal expansion and ice melt. The mid-range scenario projected 0.5-1.2m of SLR based on different representative concentration pathways (RCP) defined by the IPCC. While the pessimistic scenario added more mechanisms of ice-sheet melting, estimating SLR at 1m-2.5m in 2100, with a projection of 10m SLR at 2300.

Coastal Flooding

More frequent coastal flooding is a direct impact of sea-level rise. Based on the Global tides and surge reanalysis by Muis et al., (2016), it is estimated that the extreme coastal water level could be from 0.2 – 2.8m over the mean level. While in extreme cases like China and the Netherlands it could experience 5-10m of extreme sea levels. Here, the coastal local flood level is added on top of the projected SLR.

Pollution Scenario:

Allows choosing the RCP, the greenhouse gas concentration trajectory defined by the IPCC.  The mild level is based on RCP4.5, of 2°C temperature rise; while the Extreme level is based on RCP 8.5, of 4°C temperature rise.

Luck:

Applies to the baseline SLR, defined in the “Sea level projection” section, upon which we add flooding. “Mild” refers to the mid-range scenario of 0.5-1.2m, and “extreme” to the pessimistic scenario of 1-2.5m. We used the high-end value of each scenario (mild = 1m; extreme = 2.5m).

You might also like: Sea Level Rise by the End of the Century – New York City

References:
  • Kulp, Scott A., and Benjamin H. Strauss. “New elevation data triple estimates of global vulnerability to sea-level rise and coastal flooding.” Nature communications 10.1 (2019): 1-12.
  • Florczyk, A. J., Corbane, C., Ehrlich, D., Freire, S., Kemper, T., Maffenini, L., Melchiorri, M., Politis, P., Schiavina, M., Sabo, F. & Zanchetta, L. (2019). GHSL Data Package 2019 Public Release.
  • Kopp, R. E., DeConto, R. M., Bader, D. A., Hay, C. C., Horton, R. M., Kulp, S., Oppenheimer, M., Pollard, D. & Strauss, B. H. (2017). Evolving Understanding of Antarctic Ice-Sheet Physics and Ambiguity in Probabilistic Sea-Level Projections. Earth’s Future, 5(12), 1217–1233.
  • Kopp, R. E., Horton, R. M., Little, C. M., Mitrovica, J. X., Oppenheimer, M., Rasmussen, D. J., Strauss, B. H. & Tebaldi, C. (2014). Probabilistic 21st and 22nd Century Sea-Level Projections at a Global Network of Tide-Gauge Sites. Earth’s Future, 2(8), 383–406.
  • Kulp, S. A. & Strauss, B. H. (2019). New Elevation Data Triple Estimates of Global Vulnerability to Sea-Level Rise and Coastal Flooding. Nature Communications, 10(1), 4844. Retrieved June 21, 2020, from http://www.nature.com/articles/s41467-019-12808-z
  • Muis, S., Verlaan, M., Winsemius, H. C., Aerts, J. C. J. H. & Ward, P. J. (2016). A Global Reanalysis of Storm Surges and Extreme Sea Levels. Nature Communications, 7.

Nantes is the sixth-largest city in France, and, historically, one of its largest port cities. Much of the city’s activity and residences are built near the water, and sea level rise may cause material damage and eco-societal paralysis. 

Earth.Org has mapped the flooding that could occur in Nantes by 2100. 

—

Built on the Loire estuary, the surrounding area used to be segmented by many channels, creating small islands and sand ridges. Smaller waterways were later filled in, submerging most of the islands, leaving only the larger Isle of Nantes between the banks of the Loire. 

The river is tidal, meaning its level fluctuates with sea levels. The range can reach around 6 meters (20 feet), as a result of dredging to make the area accessible to larger ships. The eastern part of Nantes is quite flat, and the lowest points of the city are only 2 meters above sea level. 

A recent paper published in Nature estimates that, under high emissions scenarios, global sea levels could rise by an average of 1 to 2 meters by 2100. Adding the large tidal range of the Loire to this means Nantes could experience some severe flooding by the end of the century. Earth>org has mapped what this could look like, along with the amount of population that would be displaced.

sea level rise by 2100 nantes

Sea level rise projections by 2100 for two scenarios with the amount of rise in meters indicated (mild = 3m; extreme = 4m). Percentage and total population displacement indicated bottom right.

Methodology

Global mean sea level is projected to rise by 2m at the end of this century. However, in order to determine local sea level rise (SLR), one has to take into account local coastal flood levels which could be 2.8m above Mean Higher-High Water (MHHW) at extreme forecasts. These local levels bring variability to the projected SLR from 1m to 6.5m (eg. Rio vs Kolkata).

The SLR scenarios used in this study are based on the forecasts from Climate Central – Coastal Risk Screening Tool  with the following parameters:

  • Sea level Projection Source
  • Coastal Flood Level
  • Pollution Scenario
  • Luck

Sea level Projection Source:

From two highly cited journals by Kopp et al., estimating SLR mainly due to ocean thermal expansion and ice melt. The mid-range scenario projected 0.5-1.2m of SLR based on different representative concentration pathways (RCP) defined by the IPCC. While the pessimistic scenario added more mechanisms of ice-sheet melting, estimating SLR at 1m-2.5m in 2100, with a projection of 10m SLR at 2300.

Coastal Flooding

More frequent coastal flooding is a direct impact of sea-level rise. Based on the Global tides and surge reanalysis by Muis et al., (2016), it is estimated that the extreme coastal water level could be from 0.2 – 2.8m over the mean level. While in extreme cases like China and the Netherlands it could experience 5-10m of extreme sea levels. Here, the coastal local flood level is added on top of the projected SLR.

Pollution Scenario:

Allows choosing the RCP, the greenhouse gas concentration trajectory defined by the IPCC.  The mild level is based on RCP4.5, of 2°C temperature rise; while the Extreme level is based on RCP 8.5, of 4°C temperature rise.

Luck:

Applies to the baseline SLR, defined in the “Sea level projection” section, upon which we add flooding. “Mild” refers to the mid-range scenario of 0.5-1.2m, and “extreme” to the pessimistic scenario of 1-2.5m. We used the high-end value of each scenario (mild = 1m; extreme = 2.5m).

You might also like: Sea Level Rise by the End of the Century – New York City

References:
  • Kulp, Scott A., and Benjamin H. Strauss. “New elevation data triple estimates of global vulnerability to sea-level rise and coastal flooding.” Nature communications 10.1 (2019): 1-12.
  • Florczyk, A. J., Corbane, C., Ehrlich, D., Freire, S., Kemper, T., Maffenini, L., Melchiorri, M., Politis, P., Schiavina, M., Sabo, F. & Zanchetta, L. (2019). GHSL Data Package 2019 Public Release.
  • Kopp, R. E., DeConto, R. M., Bader, D. A., Hay, C. C., Horton, R. M., Kulp, S., Oppenheimer, M., Pollard, D. & Strauss, B. H. (2017). Evolving Understanding of Antarctic Ice-Sheet Physics and Ambiguity in Probabilistic Sea-Level Projections. Earth’s Future, 5(12), 1217–1233.
  • Kopp, R. E., Horton, R. M., Little, C. M., Mitrovica, J. X., Oppenheimer, M., Rasmussen, D. J., Strauss, B. H. & Tebaldi, C. (2014). Probabilistic 21st and 22nd Century Sea-Level Projections at a Global Network of Tide-Gauge Sites. Earth’s Future, 2(8), 383–406.
  • Kulp, S. A. & Strauss, B. H. (2019). New Elevation Data Triple Estimates of Global Vulnerability to Sea-Level Rise and Coastal Flooding. Nature Communications, 10(1), 4844. Retrieved June 21, 2020, from http://www.nature.com/articles/s41467-019-12808-z
  • Muis, S., Verlaan, M., Winsemius, H. C., Aerts, J. C. J. H. & Ward, P. J. (2016). A Global Reanalysis of Storm Surges and Extreme Sea Levels. Nature Communications, 7.

Newport, twelve miles north of the capital of Wales, is another city at risk of being partially submerged by sea level rise. Earth.Org has mapped what severe flooding could look like by 2100 and estimated the population displacement this would cause.

—

With a population of around 146 000 people, the city of Newport is the third-largest in Wales. Historically a coal-exporting port city, it rose to prominence in the 19th century, then shrunk again in the 20th, only to be granted city status in 2002. Largely low-lying, the southern, sea-facing side of the city is flat and fertile with many housing estates and industrial areas from reclaimed wetlands. 

If you’ve read other articles from this series, you may know that this is a strong indicator of future flood risk, because draining natural reservoirs means water surges have no way to be flushed out. Because Newport has a moderate temperate climate, it rarely experiences extreme weather, meaning little to no floods, and thus little to no flood control. 

A recent paper published in Nature estimates that, under high emissions scenarios, global sea levels could rise by an average 1 to 2 meters by 2100. If the Welsh government waits for water levels to become obviously problematic to act, it could be too late. In a call for action, Earth.Org has modelled what coastal flooding could look like in Newport by 2100. 

sea level rise by 2100 newport

Sea level rise projections by 2100 for two scenarios with the amount of rise in meters indicated (mild = 5m; extreme = 7m). Percentage and total population displacement indicated bottom right.

Methodology

Global mean sea level is projected to rise by 2m at the end of this century. However, in order to determine local sea level rise (SLR), one has to take into account local coastal flood levels which could be 2.8m above Mean Higher-High Water (MHHW) at extreme forecasts. These local levels bring variability to the projected SLR from 1m to 6.5m (eg. Rio vs Kolkata).

The SLR scenarios used in this study are based on the forecasts from Climate Central – Coastal Risk Screening Tool  with the following parameters:

  • Sea level Projection Source
  • Coastal Flood Level
  • Pollution Scenario
  • Luck

Sea level Projection Source:

From two highly cited journals by Kopp et al., estimating SLR mainly due to ocean thermal expansion and ice melt. The mid-range scenario projected 0.5-1.2m of SLR based on different representative concentration pathways (RCP) defined by the IPCC. While the pessimistic scenario added more mechanisms of ice-sheet melting, estimating SLR at 1m-2.5m in 2100, with a projection of 10m SLR at 2300.

Coastal Flooding

More frequent coastal flooding is a direct impact of sea-level rise. Based on the Global tides and surge reanalysis by Muis et al., (2016), it is estimated that the extreme coastal water level could be from 0.2 – 2.8m over the mean level. While in extreme cases like China and the Netherlands it could experience 5-10m of extreme sea levels. Here, the coastal local flood level is added on top of the projected SLR.

Pollution Scenario:

Allows choosing the RCP, the greenhouse gas concentration trajectory defined by the IPCC.  The mild level is based on RCP4.5, of 2°C temperature rise; while the Extreme level is based on RCP 8.5, of 4°C temperature rise.

Luck:

Applies to the baseline SLR, defined in the “Sea level projection” section, upon which we add flooding. “Mild” refers to the mid-range scenario of 0.5-1.2m, and “extreme” to the pessimistic scenario of 1-2.5m. We used the high-end value of each scenario (mild = 1m; extreme = 2.5m).

You might also like: Sea Level Rise by the End of the Century – New York City

References:
  • Kulp, Scott A., and Benjamin H. Strauss. “New elevation data triple estimates of global vulnerability to sea-level rise and coastal flooding.” Nature communications 10.1 (2019): 1-12.
  • Florczyk, A. J., Corbane, C., Ehrlich, D., Freire, S., Kemper, T., Maffenini, L., Melchiorri, M., Politis, P., Schiavina, M., Sabo, F. & Zanchetta, L. (2019). GHSL Data Package 2019 Public Release.
  • Kopp, R. E., DeConto, R. M., Bader, D. A., Hay, C. C., Horton, R. M., Kulp, S., Oppenheimer, M., Pollard, D. & Strauss, B. H. (2017). Evolving Understanding of Antarctic Ice-Sheet Physics and Ambiguity in Probabilistic Sea-Level Projections. Earth’s Future, 5(12), 1217–1233.
  • Kopp, R. E., Horton, R. M., Little, C. M., Mitrovica, J. X., Oppenheimer, M., Rasmussen, D. J., Strauss, B. H. & Tebaldi, C. (2014). Probabilistic 21st and 22nd Century Sea-Level Projections at a Global Network of Tide-Gauge Sites. Earth’s Future, 2(8), 383–406.
  • Kulp, S. A. & Strauss, B. H. (2019). New Elevation Data Triple Estimates of Global Vulnerability to Sea-Level Rise and Coastal Flooding. Nature Communications, 10(1), 4844. Retrieved June 21, 2020, from http://www.nature.com/articles/s41467-019-12808-z
  • Muis, S., Verlaan, M., Winsemius, H. C., Aerts, J. C. J. H. & Ward, P. J. (2016). A Global Reanalysis of Storm Surges and Extreme Sea Levels. Nature Communications, 7.

Palembang, the capital city of South Sumatra, is another city that experiences frequent flooding. Sea level rise projections for the end of the century will force this low-income country to make hard decisions – do they invest in adaptive measures? Weather the storm? Or give way and somehow move their capital to a better location?

Earth.Org has mapped severe flooding in Palembang by 2100 to illustrate the need for action.

—

Palembang occupies a vast lowland near the Bukit Barisan Mountains, on the confluence of two major tributaries to the Musi River, the Ogan and Komering Rivers. During the rainy season, from November to April, the Musi River often overflows and drowns many areas in the city. Other factors contributing to its flood proneness are poor drainage systems, and the often-observed rapid urban expansion problems of excessive groundwater extraction coupled with natural reservoir drainage. 

The mayor, Harnojoyo, has announced a plan to make Palembang flood-free by 2022. It consists in setting up pumps for water evacuation, but the subpar drainage system will also have to be revamped if these pumps are to serve any purpose. 

A recent paper published in Nature triples the “estimates of global vulnerability to sea-level rise and coastal flooding”, predicting a 1 to 2 metre increase in sea level. This is expected to hit Indonesian cities very hard, and while floods are common and mitigation measures are being taken, these seem geared toward the current flood intensity. The government of Sumatra has a chance to show foresight and build for the uncertain, yet worrisome future. We at Earth.Org have modelled what flooding could look like by 2100 to illustrate the need for action. 

sea level rise by 2100 palembang

Sea level rise projections by 2100 for two scenarios with the amount of rise in meters indicated (mild = 3m; extreme = 5m).

Methodology

Global mean sea level is projected to rise by 2m at the end of this century. However, in order to determine local sea level rise (SLR), one has to take into account local coastal flood levels which could be 2.8m above Mean Higher-High Water (MHHW) at extreme forecasts. These local levels bring variability to the projected SLR from 1m to 6.5m (eg. Rio vs Kolkata).

The SLR scenarios used in this study are based on the forecasts from Climate Central – Coastal Risk Screening Tool  with the following parameters:

  • Sea level Projection Source
  • Coastal Flood Level
  • Pollution Scenario
  • Luck

Sea level Projection Source: is from two highly cited journals by Kopp et al., estimating SLR mainly due to ocean thermal expansion and ice melt. The mid-range scenario projected 0.5-1.2m of SLR based on different representative concentration pathways (RCP) defined by the IPCC. While the pessimistic scenario added more mechanisms of ice-sheet melting, estimating SLR at 1m-2.5m in 2100, with projection of 10m SLR at 2300.

Coastal Flooding: More frequent coastal flooding is a direct impact of sea-level rise. Based on the Global tides and surge reanalysis by Muis et al., (2016), it is estimated that the extreme coastal water level could be from 0.2 – 2.8m over mean level. While in extreme cases like China and the Netherlands it could experience 5-10m of extreme sea levels. Here, the coastal local flood level is added on top of the projected SLR.

Pollution Scenario: allows to choose the RCP, the greenhouse gas concentration trajectory defined by the IPCC.  The mild level is based on RCP4.5, of 2°C temperature rise; while the Extreme level is based on RCP 8.5, of 4°C temperature rise.

Luck: applies to the baseline SLR, defined in the “Sea level projection” section, upon which we add flooding. “Mild” refers to the mid-range scenario of 0.5-1.2m, and “extreme” to the pessimistic scenario of 1-2.5m. We used the high-end value of each scenario (mild = 1m; extreme = 2.5m).

References:
  • Kulp, Scott A., and Benjamin H. Strauss. “New elevation data triple estimates of global vulnerability to sea-level rise and coastal flooding.” Nature communications 10.1 (2019): 1-12.
  • Florczyk, A. J., Corbane, C., Ehrlich, D., Freire, S., Kemper, T., Maffenini, L., Melchiorri, M., Politis, P., Schiavina, M., Sabo, F. & Zanchetta, L. (2019). GHSL Data Package 2019 Public Release.
  • Kopp, R. E., DeConto, R. M., Bader, D. A., Hay, C. C., Horton, R. M., Kulp, S., Oppenheimer, M., Pollard, D. & Strauss, B. H. (2017). Evolving Understanding of Antarctic Ice-Sheet Physics and Ambiguity in Probabilistic Sea-Level Projections. Earth’s Future, 5(12), 1217–1233.
  • Kopp, R. E., Horton, R. M., Little, C. M., Mitrovica, J. X., Oppenheimer, M., Rasmussen, D. J., Strauss, B. H. & Tebaldi, C. (2014). Probabilistic 21st and 22nd Century Sea-Level Projections at a Global Network of Tide-Gauge Sites. Earth’s Future, 2(8), 383–406.
  • Muis, S., Verlaan, M., Winsemius, H. C., Aerts, J. C. J. H. & Ward, P. J. (2016). A Global Reanalysis of Storm Surges and Extreme Sea Levels. Nature Communications, 7.
Dubai is one of the business hubs of the Middle East, concentrating its luxury experiences on its seaside with no regard for sea level rise. Despite having recently experienced city-wide flooding from torrential rain, no preventive measures are being taken. 

Earth.Org has mapped the extreme flooding Dubai may experience by 2100.

—

Dubai is home to a wealth of skyscrapers, luxury hotels and resorts, concentrated on the seaside. Many projects, like the Palm Island or the failed World Archipelago project, are built right above sea level. The trend here is a surprising disregard for rising sea levels, which have already started engulfing the remains on the World Archipelago project. 

The explanation may be that few buildings in Dubai are built to last. With the exception of some iconic buildings like the Burj Khalifa, most structures are built on sand, with shifting foundations. The Dubai Eye, world’s tallest Ferris wheel, had its base completely reconstructed because of dangerous instability. 

The focus is rather on short-term rewards. Many of the incredible structures in Dubai attract tremendous amounts of investment and consumption, for which the long-term problems are ignored. 

Earth.Org has modelled what flooding will look like in Dubai by 2100, if no action is taken. 

sea level rise by 2100 dubai

Sea level rise projections by 2100 for two scenarios with the amount of rise in meters indicated (mild = 2m; extreme = 3m). Percentage and total population displacement indicated bottom right.

Methodology

Global mean sea level is projected to rise by 2m at the end of this century. However, in order to determine local sea level rise (SLR), one has to take into account local coastal flood levels which could be 2.8m above Mean Higher-High Water (MHHW) at extreme forecasts. These local levels bring variability to the projected SLR from 1m to 6.5m (eg. Rio vs Kolkata).

The SLR scenarios used in this study are based on the forecasts from Climate Central – Coastal Risk Screening Tool  with the following parameters:

  • Sea level Projection Source
  • Coastal Flood Level
  • Pollution Scenario
  • Luck

Sea level Projection Source:

From two highly cited journals by Kopp et al., estimating SLR mainly due to ocean thermal expansion and ice melt. The mid-range scenario projected 0.5-1.2m of SLR based on different representative concentration pathways (RCP) defined by the IPCC. While the pessimistic scenario added more mechanisms of ice-sheet melting, estimating SLR at 1m-2.5m in 2100, with a projection of 10m SLR at 2300.

Coastal Flooding

More frequent coastal flooding is a direct impact of sea-level rise. Based on the Global tides and surge reanalysis by Muis et al., (2016), it is estimated that the extreme coastal water level could be from 0.2 – 2.8m over the mean level. While in extreme cases like China and the Netherlands it could experience 5-10m of extreme sea levels. Here, the coastal local flood level is added on top of the projected SLR.

Pollution Scenario:

Allows choosing the RCP, the greenhouse gas concentration trajectory defined by the IPCC.  The mild level is based on RCP4.5, of 2°C temperature rise; while the Extreme level is based on RCP 8.5, of 4°C temperature rise.

Luck:

Applies to the baseline SLR, defined in the “Sea level projection” section, upon which we add flooding. “Mild” refers to the mid-range scenario of 0.5-1.2m, and “extreme” to the pessimistic scenario of 1-2.5m. We used the high-end value of each scenario (mild = 1m; extreme = 2.5m).

You might also like: Sea Level Rise by the End of the Century – New York City

References:
  • Kulp, Scott A., and Benjamin H. Strauss. “New elevation data triple estimates of global vulnerability to sea-level rise and coastal flooding.” Nature communications 10.1 (2019): 1-12.
  • Florczyk, A. J., Corbane, C., Ehrlich, D., Freire, S., Kemper, T., Maffenini, L., Melchiorri, M., Politis, P., Schiavina, M., Sabo, F. & Zanchetta, L. (2019). GHSL Data Package 2019 Public Release.
  • Kopp, R. E., DeConto, R. M., Bader, D. A., Hay, C. C., Horton, R. M., Kulp, S., Oppenheimer, M., Pollard, D. & Strauss, B. H. (2017). Evolving Understanding of Antarctic Ice-Sheet Physics and Ambiguity in Probabilistic Sea-Level Projections. Earth’s Future, 5(12), 1217–1233.
  • Kopp, R. E., Horton, R. M., Little, C. M., Mitrovica, J. X., Oppenheimer, M., Rasmussen, D. J., Strauss, B. H. & Tebaldi, C. (2014). Probabilistic 21st and 22nd Century Sea-Level Projections at a Global Network of Tide-Gauge Sites. Earth’s Future, 2(8), 383–406.
  • Kulp, S. A. & Strauss, B. H. (2019). New Elevation Data Triple Estimates of Global Vulnerability to Sea-Level Rise and Coastal Flooding. Nature Communications, 10(1), 4844. Retrieved June 21, 2020, from http://www.nature.com/articles/s41467-019-12808-z
  • Muis, S., Verlaan, M., Winsemius, H. C., Aerts, J. C. J. H. & Ward, P. J. (2016). A Global Reanalysis of Storm Surges and Extreme Sea Levels. Nature Communications, 7.
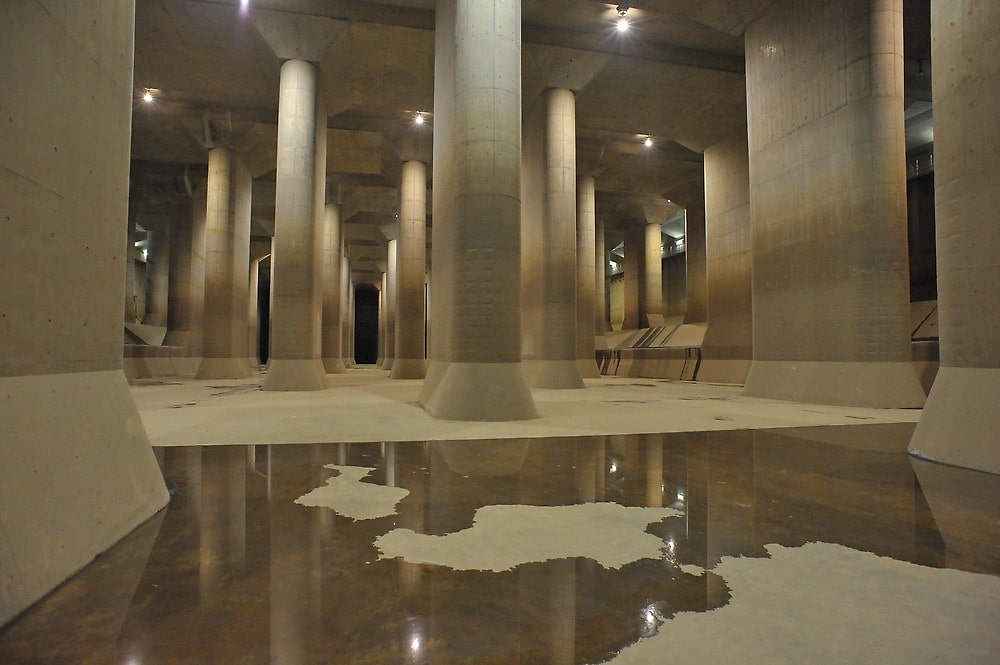
Torrential rain often causes flooding and landslides in Japan, leaving destruction, death and injury behind. Tokyo is no exception, which is why officials had the world’s largest water drainage facility built under the megalopolis. Will it be enough to fend off the rising waters? 

Earth.Org takes a closer look. 

—

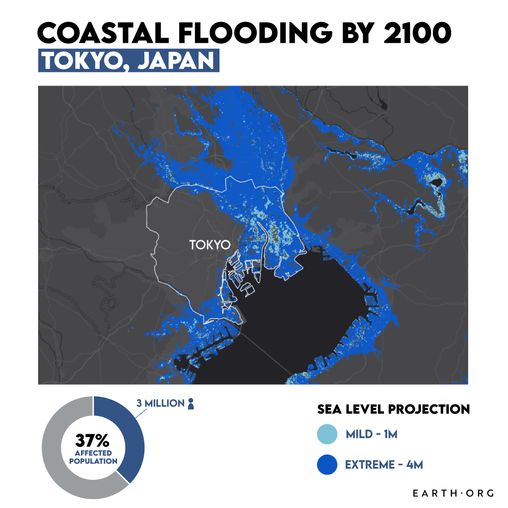
How will rising sea levels affect Tokyo, Japan?

The Tokyo Metropolis is home to nearly 14 million people, and the Greater Tokyo area to more than 37 million. It sits on a floodplain surrounded by five large rivers that regularly overflow. Moreover, rapid urban expansion combined with excessive groundwater extraction are causing the land to subside. These factors magnify floods from frequent typhoons and have forced city planners to create innovative and ambitious flood control systems, such as the Metropolitan Area Outer Underground Discharge Channel (commonly called G-cans). 

sea level rise by 2100 Tokyo

One of the 5 water silos of the Metropolitan Area Outer Underground Discharge Channel. Credit: Edogawa River Office

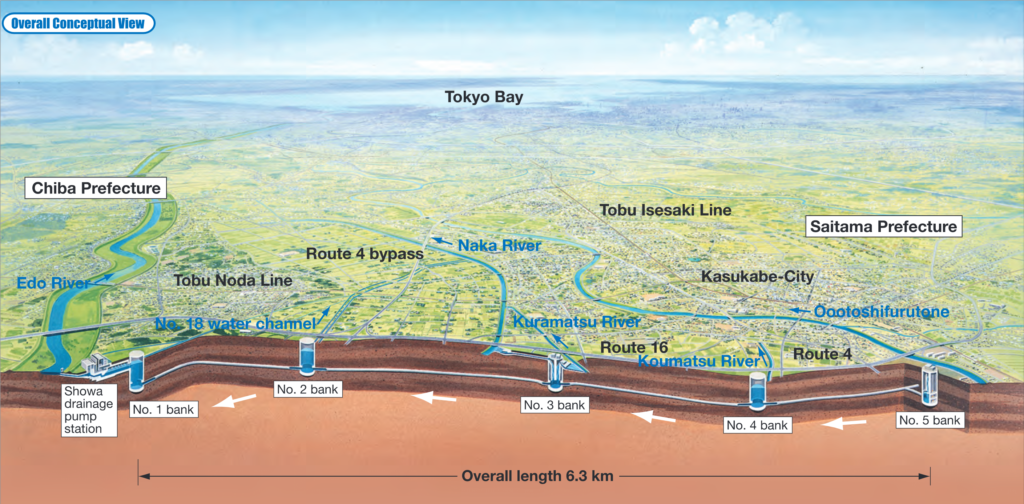
The complex was finished in 2006 after 14 years of construction, and cost around USD $2 billion. It consists of 5 huge silos under each of the five rivers Tokyo is built around, with a tunnel system allowing water to flow unidirectionally toward a giant pump at the endpoint. The structure measures 6.3km from end to end, and the pump can force 200 tons of water out into the Edo River per second.  

G-Cans map Tokyo

Map of the Metropolitan Area Outer Underground Discharge Channel. Credit: Edo River Office.

Despite the scale of the installation, its upper limits have already been tested. In 2015, a typhoon filled the G-cans enough for the pump to take 4 full days to empty them. This is not to say that the Discharge Channel is not performing well, but it may not be sufficient to protect Tokyo against the downpours and sea level rise that the latest assessments expect. 

In fact, sea level rise is projected to hit Japan particularly hard. Local water rise of 2 metres could put nearly 200 km² of the area under water. Even if this is somehow mitigated, the additional pressure of a strong typhoon would surely overwhelm anything but the best flood control system imaginable. Despite their accomplishments so far, the Japanese cannot rest easy yet. Earth.Org has modelled what flooding on top of extreme sea level rise could look like in Tokyo by 2100 to illustrate the predicament. 

tokyo sea level rise projection map

Methodology

Global mean sea level is projected to rise by 2m at the end of this century. However, in order to determine local sea level rise (SLR), one has to take into account local coastal flood levels which could be 2.8m above Mean Higher-High Water (MHHW) at extreme forecasts. These local levels bring variability to the projected SLR from 1m to 6.5m (eg. Rio vs Kolkata).

The SLR scenarios used in this study are based on the forecasts from Climate Central – Coastal Risk Screening Tool  with the following parameters:

  • Sea level Projection Source
  • Coastal Flood Level
  • Pollution Scenario
  • Luck

Sea level Projection Source: is from two highly cited journals by Kopp et al., estimating SLR mainly due to ocean thermal expansion and ice melt. The mid-range scenario projected 0.5-1.2m of SLR based on different representative concentration pathways (RCP) defined by the IPCC. While the pessimistic scenario added more mechanisms of ice-sheet melting, estimating SLR at 1m-2.5m in 2100, with projection of 10m SLR at 2300.

Coastal Flooding: More frequent coastal flooding is a direct impact of sea-level rise. Based on the Global tides and surge reanalysis by Muis et al., (2016), it is estimated that the extreme coastal water level could be from 0.2 – 2.8m over mean level. While in extreme cases like China and the Netherlands it could experience 5-10m of extreme sea levels. Here, the coastal local flood level is added on top of the projected SLR.

Pollution Scenario: allows to choose the RCP, the greenhouse gas concentration trajectory defined by the IPCC.  The mild level is based on RCP4.5, of 2°C temperature rise; while Extreme level is based on RCP 8.5, of 4°C temperature rise.

Luck: applies to the the baseline SLR, defined in the “Sea level projection” section, upon which we add flooding. “Mild” refers to the mid-range scenario of 0.5-1.2m, and “extreme” to the pessimistic scenario of 1-2.5m. We used the high-end value of each scenario (mild = 1m; extreme = 2.5m).

References:
  • Kulp, Scott A., and Benjamin H. Strauss. “New elevation data triple estimates of global vulnerability to sea-level rise and coastal flooding.” Nature communications 10.1 (2019): 1-12.
  • Florczyk, A. J., Corbane, C., Ehrlich, D., Freire, S., Kemper, T., Maffenini, L., Melchiorri, M., Politis, P., Schiavina, M., Sabo, F. & Zanchetta, L. (2019). GHSL Data Package 2019 Public Release.
  • Kopp, R. E., DeConto, R. M., Bader, D. A., Hay, C. C., Horton, R. M., Kulp, S., Oppenheimer, M., Pollard, D. & Strauss, B. H. (2017). Evolving Understanding of Antarctic Ice-Sheet Physics and Ambiguity in Probabilistic Sea-Level Projections. Earth’s Future, 5(12), 1217–1233.
  • Kopp, R. E., Horton, R. M., Little, C. M., Mitrovica, J. X., Oppenheimer, M., Rasmussen, D. J., Strauss, B. H. & Tebaldi, C. (2014). Probabilistic 21st and 22nd Century Sea-Level Projections at a Global Network of Tide-Gauge Sites. Earth’s Future, 2(8), 383–406.
  • Kulp, S. A. & Strauss, B. H. (2019). New Elevation Data Triple Estimates of Global Vulnerability to Sea-Level Rise and Coastal Flooding. Nature Communications, 10(1), 4844. Retrieved June 21, 2020, from http://www.nature.com/articles/s41467-019-12808-z
  • Muis, S., Verlaan, M., Winsemius, H. C., Aerts, J. C. J. H. & Ward, P. J. (2016). A Global Reanalysis of Storm Surges and Extreme Sea Levels. Nature Communications, 7.
Venice Is Sinking Due to Sea Level Rise: Will it Go Under?

There are few cities who are as vulnerable to flooding as a result of sea level rise as Venice, with the city having experienced record floods in late 2019 that at one point submerged 70% of the city and rose to over six feet in some areas. 

Earth.Org has mapped the high-level flood potential the low-lying Italian city and World Heritage Site could suffer by 2100.

—

“Acqua alta”- “high water” in Italian- is the term used to describe the exceptional tide peaks that occur in Venice between autumn and spring. While the Acqua Alta is periodic, its frequency has increased from under 10 times a year to over 60 in the last century. 

Besides the physical flooding that affected the more than 260 000 Venetian residents, the November floods that authorities labelled as ‘apocalyptic’ caused €360 million worth of damage to public property. Priceless cultural heritage sites have also been damaged.

A recent paper published in Nature estimates that, under high emissions scenarios, global sea levels could rise by an average 1 to 2 meters by 2100. This would certainly increase the occurrence of so-called “100-year floods,” the term used to define a flood that statistically has a 1% chance of occurring in any given year. In Venice’s case, this, in addition to the already-damaging Acqua Alta, will wreak unimaginable havoc; Earth.Org has modelled what such a flood would look like.

sea level rise by 2100 venice

Sea level rise projections by 2100 for two scenarios with the amount of rise in meters indicated (mild = 2m; extreme = 4m). Percentage and total population displacement indicated bottom right.

The Italian government has been conducting the MOSE project (Modulo Sperimentale Elettromeccanico, or Experimental Electromechanical Module) since 2003, which places flood barriers around the city to protect it from high waters. However, development slowed down in recent years due to corruption, lack of funding and the sheer complexity of the plan. Following the November floods, Italy has announced that it will resume the unfinished barriers and predicts that it will be completed by the end of 2021.

The climate crisis and its associated impacts- like flooding due to sea level rise, but also droughts and extreme weather events- are becoming more frequent and more intense. Melting ice sheets and the sea level rise that results from this is one such impact that is already affecting millions of people around the world.

Methodology

Global mean sea level is projected to rise by 2m at the end of this century. However, in order to determine local sea level rise (SLR), one has to take into account local coastal flood levels which could be 2.8m above Mean Higher-High Water (MHHW) at extreme forecasts. These local levels bring variability to the projected SLR from 1m to 6.5m (eg. Rio vs Kolkata).

The SLR scenarios used in this study are based on the forecasts from Climate Central – Coastal Risk Screening Tool  with the following parameters:

  • Sea level Projection Source
  • Coastal Flood Level
  • Pollution Scenario
  • Luck

Sea level Projection Source: is from two highly cited journals by Kopp et al., estimating SLR mainly due to ocean thermal expansion and ice melt. The mid-range scenario projected 0.5-1.2m of SLR based on different representative concentration pathways (RCP) defined by the IPCC. While the pessimistic scenario added more mechanisms of ice-sheet melting, estimating SLR at 1m-2.5m in 2100, with projection of 10m SLR at 2300.

Coastal Flooding: More frequent coastal flooding is a direct impact of sea-level rise. Based on the Global tides and surge reanalysis by Muis et al., (2016), it is estimated that the extreme coastal water level could be from 0.2 – 2.8m over mean level. While in extreme cases like China and the Netherlands it could experience 5-10m of extreme sea levels. Here, the coastal local flood level is added on top of the projected SLR.

Pollution Scenario: allows to choose the RCP, the greenhouse gas concentration trajectory defined by the IPCC.  The mild level is based on RCP4.5, of 2°C temperature rise; while Extreme level is based on RCP 8.5, of 4°C temperature rise.

Luck: applies to the the baseline SLR, defined in the “Sea level projection” section, upon which we add flooding. “Mild” refers to the mid-range scenario of 0.5-1.2m, and “extreme” to the pessimistic scenario of 1-2.5m. We used the high-end value of each scenario (mild = 1m; extreme = 2.5m).

References:
  • Kulp, Scott A., and Benjamin H. Strauss. “New elevation data triple estimates of global vulnerability to sea-level rise and coastal flooding.” Nature communications 10.1 (2019): 1-12.
  • Florczyk, A. J., Corbane, C., Ehrlich, D., Freire, S., Kemper, T., Maffenini, L., Melchiorri, M., Politis, P., Schiavina, M., Sabo, F. & Zanchetta, L. (2019). GHSL Data Package 2019 Public Release.
  • Kopp, R. E., DeConto, R. M., Bader, D. A., Hay, C. C., Horton, R. M., Kulp, S., Oppenheimer, M., Pollard, D. & Strauss, B. H. (2017). Evolving Understanding of Antarctic Ice-Sheet Physics and Ambiguity in Probabilistic Sea-Level Projections. Earth’s Future, 5(12), 1217–1233.
  • Kopp, R. E., Horton, R. M., Little, C. M., Mitrovica, J. X., Oppenheimer, M., Rasmussen, D. J., Strauss, B. H. & Tebaldi, C. (2014). Probabilistic 21st and 22nd Century Sea-Level Projections at a Global Network of Tide-Gauge Sites. Earth’s Future, 2(8), 383–406.
  • Muis, S., Verlaan, M., Winsemius, H. C., Aerts, J. C. J. H. & Ward, P. J. (2016). A Global Reanalysis of Storm Surges and Extreme Sea Levels. Nature Communications, 7.

Singapore is one of the many cities that will be vulnerable to extreme flooding as sea levels rise. The city often experiences flash floods after intense rainfall, and the number of floods per year has been on the rise. 

Earth.Org has mapped the high-level flood potential the low-lying city could suffer by 2100 with current sea level rise projections. 

—

Local sea level measurements have shown a rise of 14 cm in Singapore compared to pre-1970 levels. The Prime Minister Lee Hsien Loong has recognized the looming threat this represents and drafted a plan for coastal defence. A Sg$100 billion dollar fund has been dedicated to adapt Singapore’s infrastructure to the rising water levels over the next 100 years. 

The previous requirements forced city planners to construct buildings three metres (9.9 feet) above sea level, leaving a 1 metre buffer against the two metre tide shifts. This will be changed to four metres for most buildings, but critical infrastructure like the Changi Airport’s Terminal 5 will be given a five metre buffer. It is difficult for scientists to agree on future models, so it remains to be seen whether the Singaporean precautionary measures will be sufficient. 

A recent paper published in Nature estimates that, under high emissions scenarios, global sea levels could rise by an average 1 to 2 meters by 2100. This would certainly increase the occurrence of so-called “100-year floods,” the term used to define a flood that statistically has a 1% chance of occurring in any given year. If one of these surges hit Singapore, this is what it would look like.

sea level rise by 2100 singapore

Sea level rise projections by 2100 for two scenarios with the amount of rise in meters indicated (mild = 3m; extreme = 5m). Percentage and total population displacement indicated bottom right.

Methodology

Global mean sea level is projected to rise by 2m at the end of this century. However, in order to determine local sea level rise (SLR), one has to take into account local coastal flood levels which could be 2.8m above Mean Higher-High Water (MHHW) at extreme forecasts. These local levels bring variability to the projected SLR from 1m to 6.5m (eg. Rio vs Kolkata).

The SLR scenarios used in this study are based on the forecasts from Climate Central – Coastal Risk Screening Tool  with the following parameters:

  • Sea level Projection Source
  • Coastal Flood Level
  • Pollution Scenario
  • Luck

Sea level Projection Source: is from two highly cited journals by Kopp et al., estimating SLR mainly due to ocean thermal expansion and ice melt. The mid-range scenario projected 0.5-1.2m of SLR based on different representative concentration pathways (RCP) defined by the IPCC. While the pessimistic scenario added more mechanisms of ice-sheet melting, estimating SLR at 1m-2.5m in 2100, with projection of 10m SLR at 2300.

Coastal Flooding: More frequent coastal flooding is a direct impact of sea-level rise. Based on the Global tides and surge reanalysis by Muis et al., (2016), it is estimated that the extreme coastal water level could be from 0.2 – 2.8m over mean level. While in extreme cases like China and the Netherlands it could experience 5-10m of extreme sea levels. Here, the coastal local flood level is added on top of the projected SLR.

Pollution Scenario: allows to choose the RCP, the greenhouse gas concentration trajectory defined by the IPCC.  The mild level is based on RCP4.5, of 2°C temperature rise; while Extreme level is based on RCP 8.5, of 4°C temperature rise.

Luck: applies to the the baseline SLR, defined in the “Sea level projection” section, upon which we add flooding. “Mild” refers to the mid-range scenario of 0.5-1.2m, and “extreme” to the pessimistic scenario of 1-2.5m. We used the high-end value of each scenario (mild = 1m; extreme = 2.5m).

References:
  • Kulp, Scott A., and Benjamin H. Strauss. “New elevation data triple estimates of global vulnerability to sea-level rise and coastal flooding.” Nature communications 10.1 (2019): 1-12.
  • Florczyk, A. J., Corbane, C., Ehrlich, D., Freire, S., Kemper, T., Maffenini, L., Melchiorri, M., Politis, P., Schiavina, M., Sabo, F. & Zanchetta, L. (2019). GHSL Data Package 2019 Public Release.
    Kopp, R. E., DeConto, R. M., Bader, D. A., Hay, C. C., Horton, R. M., Kulp, S., Oppenheimer, M., Pollard, D. & Strauss, B. H. (2017). Evolving Understanding of Antarctic Ice-Sheet Physics and Ambiguity in Probabilistic Sea-Level Projections. Earth’s Future, 5(12), 1217–1233.
    Kopp, R. E., Horton, R. M., Little, C. M., Mitrovica, J. X., Oppenheimer, M., Rasmussen, D. J., Strauss, B. H. & Tebaldi, C. (2014). Probabilistic 21st and 22nd Century Sea-Level Projections at a Global Network of Tide-Gauge Sites. Earth’s Future, 2(8), 383–406.
    Kulp, S. A. & Strauss, B. H. (2019). New Elevation Data Triple Estimates of Global Vulnerability to Sea-Level Rise and Coastal Flooding. Nature Communications, 10(1), 4844. Retrieved June 21, 2020, from http://www.nature.com/articles/s41467-019-12808-z
    Muis, S., Verlaan, M., Winsemius, H. C., Aerts, J. C. J. H. & Ward, P. J. (2016). A Global Reanalysis of Storm Surges and Extreme Sea Levels. Nature Communications, 7.

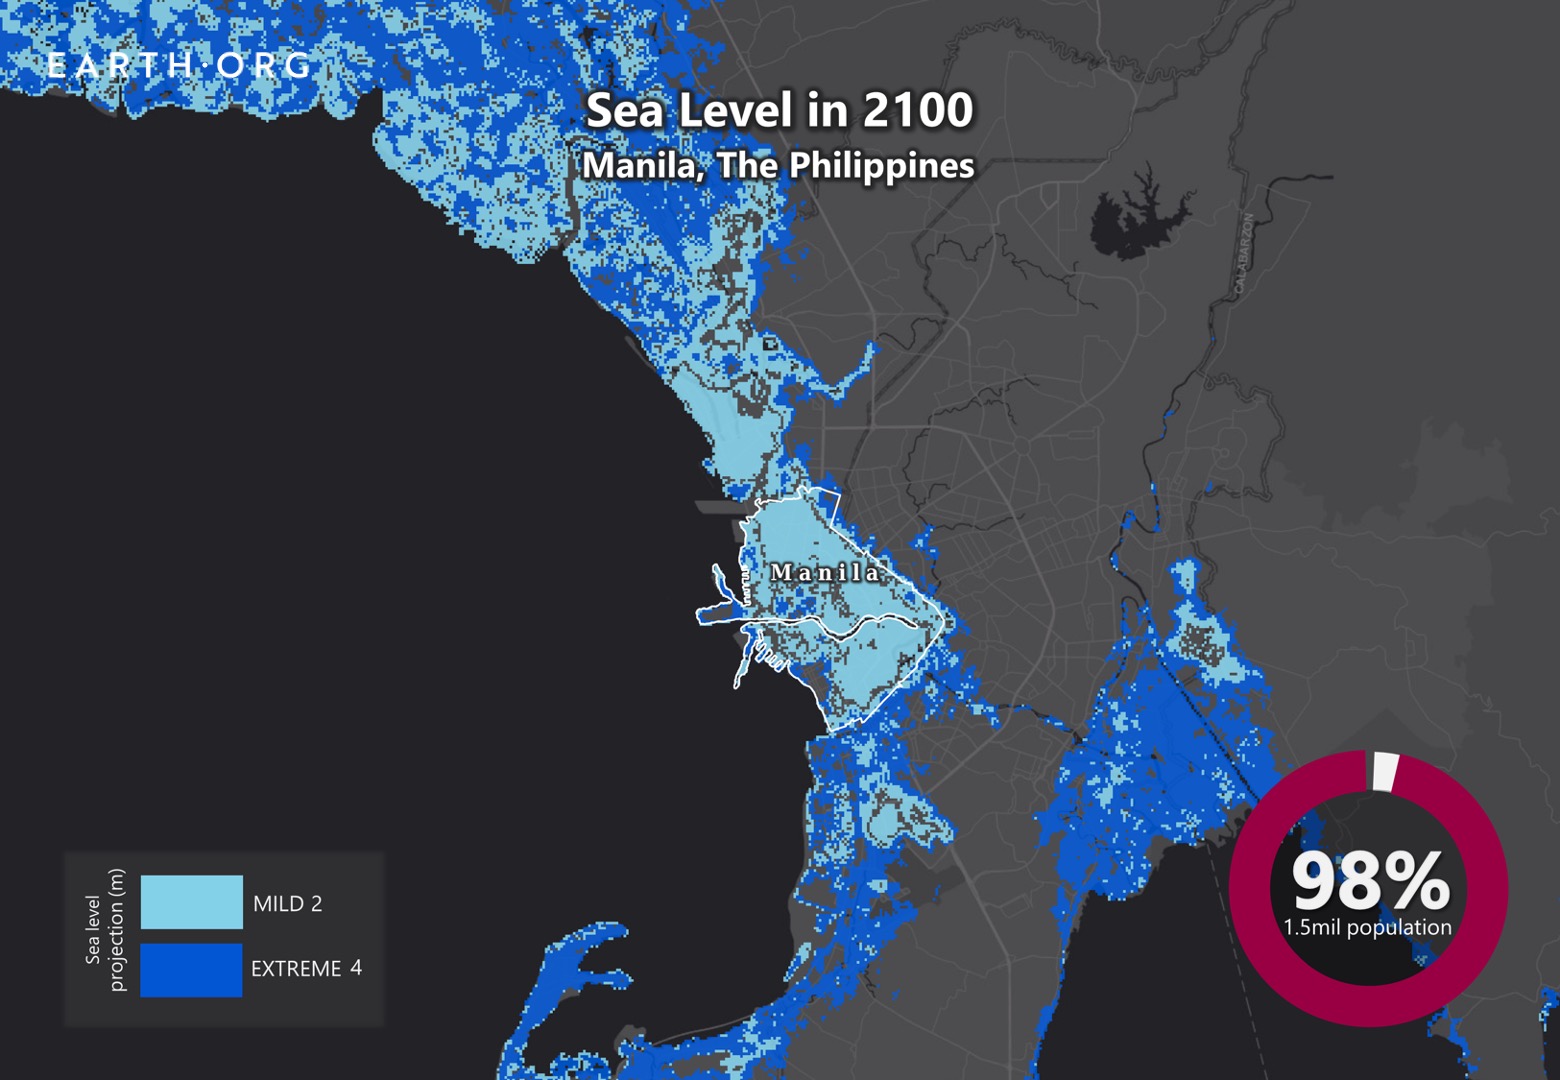
Manila is sinking. Will it succumb to rising sea levels? There are few cities as vulnerable to sea level rise as metropolitan Manila, lying partly beneath sea level due to intense groundwater pumping. As sea levels rise, the 14 million inhabitants of Manila become more exposed, and preventive measures that aren’t adequate today will be insignificant unless action is taken.

Earth.Org has mapped the high-level flood potential the low-lying city could suffer by 2100. 

—

When talking about rising sea levels, the challenge is sometimes to raise awareness of a problem that has yet to affect the citizens’ daily lives. This is not the case in Manila, where severe flooding happens frequently. The Philippines is one of the most disaster-prone countries in the world, experiencing more than 20 typhoons a year. 

The majority of the city’s drainage systems are sub-par, and cannot evacuate water from heavy rainfall fast enough to avoid flooding. Water subsidence took an average of 18.5 minutes in 2017, and 30 minutes in 2018, so things are getting worse. Why? The Metropolitan Manila Development Authority (MMDA) admitted in 2019 that 60% of the drainage systems were clogged and silted. Moreover, The Commission on Audit found that only 53 of the 170 flood prevention programs in 2018 were completed. 

Worse yet, short-sighted policy-making has allowed rapid groundwater drainage, causing the city to sag into a bowl-like shape. Many of Manila’s citizens live in poor conditions, with an estimated 3 million people in informal settlements (shantytowns). Moving away would mean losing their jobs and access to healthcare and other benefits from city infrastructure. 

Projected sea level rise will amplify the threats of material damage and population displacement Manila’s floods already present. We illustrate what some of these extreme flooding events could look like by 2100 below.

sea level rise by 2100 manila

Sea level rise projections by 2100 for two scenarios with the amount of rise indicated in meters (mild = 2m; extreme = 4m). Percentage and total population displacement indicated bottom right.

Sea Level Rise Methodology

Global mean sea level is projected to rise by 2m at the end of this century. However, in order to determine local sea level rise (SLR), one has to take into account local coastal flood levels which could be 2.8m above Mean Higher-High Water (MHHW) at extreme forecasts. These local levels bring variability to the projected SLR from 1m to 6.5m (eg. Rio vs Kolkata).

The SLR scenarios used in this study are based on the forecasts from Climate Central – Coastal Risk Screening Tool  with the following parameters:

  • Sea level Projection Source
  • Coastal Flood Level
  • Pollution Scenario
  • Luck

Sea level Projection Source: is from two highly cited journals by Kopp et al., estimating SLR mainly due to ocean thermal expansion and ice melt. The mid-range scenario projected 0.5-1.2m of SLR based on different representative concentration pathways (RCP) defined by the IPCC. While the pessimistic scenario added more mechanisms of ice-sheet melting, estimating SLR at 1m-2.5m in 2100, with projection of 10m SLR at 2300.

Coastal Flooding: More frequent coastal flooding is a direct impact of sea-level rise. Based on the Global tides and surge reanalysis by Muis et al., (2016), it is estimated that the extreme coastal water level could be from 0.2 – 2.8m over mean level. While in extreme cases like China and the Netherlands it could experience 5-10m of extreme sea levels. Here, the coastal local flood level is added on top of the projected SLR.

Pollution Scenario: allows to choose the RCP, the greenhouse gas concentration trajectory defined by the IPCC.  The mild level is based on RCP4.5, of 2°C temperature rise; while Extreme level is based on RCP 8.5, of 4°C temperature rise.

Luck: applies to the the baseline SLR, defined in the “Sea level projection” section, upon which we add flooding. “Mild” refers to the mid-range scenario of 0.5-1.2m, and “extreme” to the pessimistic scenario of 1-2.5m. We used the high-end value of each scenario (mild = 1m; extreme = 2.5m).

References:
  • Kulp, Scott A., and Benjamin H. Strauss. “New elevation data triple estimates of global vulnerability to sea-level rise and coastal flooding.” Nature communications 10.1 (2019): 1-12.
  • Florczyk, A. J., Corbane, C., Ehrlich, D., Freire, S., Kemper, T., Maffenini, L., Melchiorri, M., Politis, P., Schiavina, M., Sabo, F. & Zanchetta, L. (2019). GHSL Data Package 2019 Public Release.
    Kopp, R. E., DeConto, R. M., Bader, D. A., Hay, C. C., Horton, R. M., Kulp, S., Oppenheimer, M., Pollard, D. & Strauss, B. H. (2017). Evolving Understanding of Antarctic Ice-Sheet Physics and Ambiguity in Probabilistic Sea-Level Projections. Earth’s Future, 5(12), 1217–1233.
    Kopp, R. E., Horton, R. M., Little, C. M., Mitrovica, J. X., Oppenheimer, M., Rasmussen, D. J., Strauss, B. H. & Tebaldi, C. (2014). Probabilistic 21st and 22nd Century Sea-Level Projections at a Global Network of Tide-Gauge Sites. Earth’s Future, 2(8), 383–406.
    Kulp, S. A. & Strauss, B. H. (2019). New Elevation Data Triple Estimates of Global Vulnerability to Sea-Level Rise and Coastal Flooding. Nature Communications, 10(1), 4844. Retrieved June 21, 2020, from http://www.nature.com/articles/s41467-019-12808-z
    Muis, S., Verlaan, M., Winsemius, H. C., Aerts, J. C. J. H. & Ward, P. J. (2016). A Global Reanalysis of Storm Surges and Extreme Sea Levels. Nature Communications, 7.
Like any city built around a major river, London may be exposed to flooding as a result of sea level rise. Despite its government’s recognition of climate change and its wealth, at least 1 million Londoners live in a natural floodplain, and 16% of the city’s properties are considered to be at risk. 

Earth.Org has mapped the high-level flood potential London could suffer by 2100.

—

Londoners have been aware of the Thames river’s threat for a long time, and decided to build a large flood defence system that was completed 1982. It spans 520 meters across, and lifts up 10 steel gates to shut off the river’s flow, guarding London against tidal surges. There has been a lot of variation in how many uses these barriers have seen per year, but they had to be shut 50 times in 2013-2014, which was far above average.

The barriers aren’t expected to make it past 2070 before they need a replacement, and the UK Environment Agency’s plan for flood defence will cost several billion pounds. We model what extreme flooding in 2100 would look like in London in the absence of the barriers, demonstrating why it is so crucial for governments to allocate resources for preventive measures.

sea level rise by 2100 london

Sea level rise projections by 2100 for two scenarios with the amount of rise in meters indicated (mild = 4m; extreme = 6m). Percentage and total population displacement indicated bottom right.

Methodology

Global mean sea level is projected to rise by 2m at the end of this century. However, in order to determine local sea level rise (SLR), one has to take into account local coastal flood levels which could be 2.8m above Mean Higher-High Water (MHHW) at extreme forecasts. These local levels bring variability to the projected SLR from 1m to 6.5m (eg. Rio vs Kolkata).

The SLR scenarios used in this study are based on the forecasts from Climate Central – Coastal Risk Screening Tool  with the following parameters:

  • Sea level Projection Source
  • Coastal Flood Level
  • Pollution Scenario
  • Luck

Sea level Projection Source: is from two highly cited journals by Kopp et al., estimating SLR mainly due to ocean thermal expansion and ice melt. The mid-range scenario projected 0.5-1.2m of SLR based on different representative concentration pathways (RCP) defined by the IPCC. While the pessimistic scenario added more mechanisms of ice-sheet melting, estimating SLR at 1m-2.5m in 2100, with projection of 10m SLR at 2300.

Coastal Flooding: More frequent coastal flooding is a direct impact of sea-level rise. Based on the Global tides and surge reanalysis by Muis et al., (2016), it is estimated that the extreme coastal water level could be from 0.2 – 2.8m over mean level. While in extreme cases like China and the Netherlands it could experience 5-10m of extreme sea levels. Here, the coastal local flood level is added on top of the projected SLR.

Pollution Scenario: allows to choose the RCP, the greenhouse gas concentration trajectory defined by the IPCC.  The mild level is based on RCP4.5, of 2°C temperature rise; while Extreme level is based on RCP 8.5, of 4°C temperature rise.

Luck: applies to the the baseline SLR, defined in the “Sea level projection” section, upon which we add flooding. “Mild” refers to the mid-range scenario of 0.5-1.2m, and “extreme” to the pessimistic scenario of 1-2.5m. We used the high-end value of each scenario (mild = 1m; extreme = 2.5m).

You might also like: Sea Level Rise by the End of the Century – Guangzhou

References:
  • Kulp, Scott A., and Benjamin H. Strauss. “New elevation data triple estimates of global vulnerability to sea-level rise and coastal flooding.” Nature communications 10.1 (2019): 1-12.
  • Florczyk, A. J., Corbane, C., Ehrlich, D., Freire, S., Kemper, T., Maffenini, L., Melchiorri, M., Politis, P., Schiavina, M., Sabo, F. & Zanchetta, L. (2019). GHSL Data Package 2019 Public Release.
  • Kopp, R. E., DeConto, R. M., Bader, D. A., Hay, C. C., Horton, R. M., Kulp, S., Oppenheimer, M., Pollard, D. & Strauss, B. H. (2017). Evolving Understanding of Antarctic Ice-Sheet Physics and Ambiguity in Probabilistic Sea-Level Projections. Earth’s Future, 5(12), 1217–1233.
  • Kopp, R. E., Horton, R. M., Little, C. M., Mitrovica, J. X., Oppenheimer, M., Rasmussen, D. J., Strauss, B. H. & Tebaldi, C. (2014). Probabilistic 21st and 22nd Century Sea-Level Projections at a Global Network of Tide-Gauge Sites. Earth’s Future, 2(8), 383–406.
  • Kulp, S. A. & Strauss, B. H. (2019). New Elevation Data Triple Estimates of Global Vulnerability to Sea-Level Rise and Coastal Flooding. Nature Communications, 10(1), 4844. Retrieved June 21, 2020, from http://www.nature.com/articles/s41467-019-12808-z
  • Muis, S., Verlaan, M., Winsemius, H. C., Aerts, J. C. J. H. & Ward, P. J. (2016). A Global Reanalysis of Storm Surges and Extreme Sea Levels. Nature Communications, 7.
Subscribe to our newsletters

The best environmental stories of the week and month, handpicked by our Editor. Make sure you're on top of what's new in the climate.

SUBSCRIBE