Sign Up
Earth.Org Newsletters

Sign up to our weekly easy-to-digest recap of climate news from around the world.

Earth.Org PAST · PRESENT · FUTURE

Jakarta is frequently subjected to earthquakes, landslides and flash floods that take lives and displace thousands of people. Uncontrolled groundwater drainage has led the city to sink at alarming rates, which, combined with rising sea levels is expected to fully sink the city by the end of the century. 

Earth.Org has mapped the extreme flooding potential Jakarta could face by 2100. 

—

Jakarta is the largest city and capital of Indonesia. It lies on the northwest coast of Java at the mouth of the Ciliwung river. With a population of 10 million people, and a metropolitan area housing 30 million, it is set to become the world’s largest mega-city. The 662 km2 area it covers averages 7 metres above sea level, but 40% stands below this threshold, especially in the northern, sea-adjacent area. When high tides coincide with heavy rain, water fills out these low-lying areas causing casualties (66 in 2020), infrastructure damage and crippling socio-economic activity.

Jakarta has been steadily growing in population and size since the 1940s and many of its inhabitants come in search of better economic conditions. This expansion has been poorly controlled by the government, and has led to a particularly harmful practice. Poorer households use groundwater because piped water is considered a luxury. Excessive groundwater drainage is making Jakarta sink about 5 to 10 centimetres each year, about 130 times faster than sea level rise. 

The dangerous combination of rising waters and sinking land means Jakarta will likely be partly submerged by 2050. The government plans to spend USD $33 billion to move the entire city, but they maybe could have cushioned the blow had they regulated the city’s expansion with more care. 

We have modelled what extreme flooding, combining storm surges, high tides and rising sea levels would look like in Jakarta by 2100 if no action is taken.
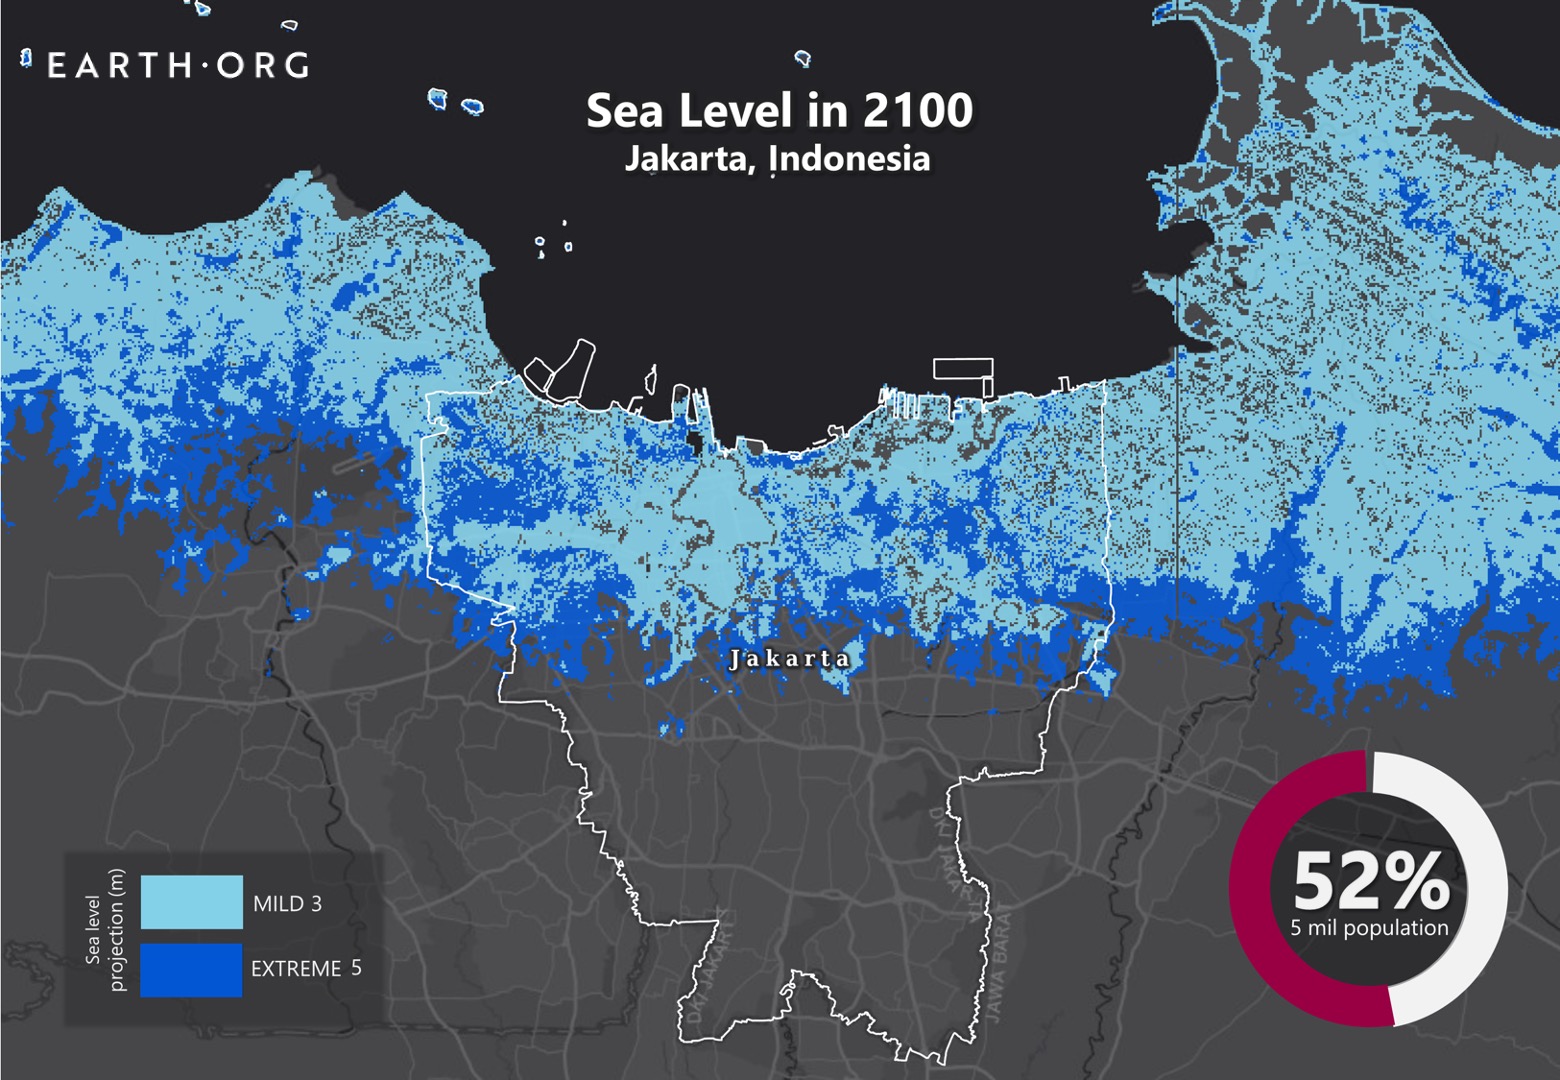
sea level rise by 2100 jakarta

Sea level rise projections by 2100 for two scenarios with the amount of rise in meters indicated (mild = 3m; extreme = 5m). Percentage and total population displacement indicated bottom right.

Methodology

Global mean sea level is projected to rise by 2m at the end of this century. However, in order to determine local sea level rise (SLR), one has to take into account local coastal flood levels which could be 2.8m above Mean Higher-High Water (MHHW) at extreme forecasts. These local levels bring variability to the projected SLR from 1m to 6.5m (eg. Rio vs Kolkata).

The SLR scenarios used in this study are based on the forecasts from Climate Central – Coastal Risk Screening Tool  with the following parameters:

  • Sea level Projection Source
  • Coastal Flood Level
  • Pollution Scenario
  • Luck

Sea level Projection Source: is from two highly cited journals by Kopp et al., estimating SLR mainly due to ocean thermal expansion and ice melt. The mid-range scenario projected 0.5-1.2m of SLR based on different representative concentration pathways (RCP) defined by the IPCC. While the pessimistic scenario added more mechanisms of ice-sheet melting, estimating SLR at 1m-2.5m in 2100, with projection of 10m SLR at 2300.

Coastal Flooding: More frequent coastal flooding is a direct impact of sea-level rise. Based on the Global tides and surge reanalysis by Muis et al., (2016), it is estimated that the extreme coastal water level could be from 0.2 – 2.8m over mean level. While in extreme cases like China and the Netherlands it could experience 5-10m of extreme sea levels. Here, the coastal local flood level is added on top of the projected SLR.

Pollution Scenario: allows to choose the RCP, the greenhouse gas concentration trajectory defined by the IPCC.  The mild level is based on RCP4.5, of 2°C temperature rise; while Extreme level is based on RCP 8.5, of 4°C temperature rise.

Luck: applies to the the baseline SLR, defined in the “Sea level projection” section, upon which we add flooding. “Mild” refers to the mid-range scenario of 0.5-1.2m, and “extreme” to the pessimistic scenario of 1-2.5m. We used the high-end value of each scenario (mild = 1m; extreme = 2.5m).

You might also like: Sea Level Rise by 2100 – Guangzhou

References:
  • Kulp, Scott A., and Benjamin H. Strauss. “New elevation data triple estimates of global vulnerability to sea-level rise and coastal flooding.” Nature communications 10.1 (2019): 1-12.
  • Florczyk, A. J., Corbane, C., Ehrlich, D., Freire, S., Kemper, T., Maffenini, L., Melchiorri, M., Politis, P., Schiavina, M., Sabo, F. & Zanchetta, L. (2019). GHSL Data Package 2019 Public Release.
    Kopp, R. E., DeConto, R. M., Bader, D. A., Hay, C. C., Horton, R. M., Kulp, S., Oppenheimer, M., Pollard, D. & Strauss, B. H. (2017). Evolving Understanding of Antarctic Ice-Sheet Physics and Ambiguity in Probabilistic Sea-Level Projections. Earth’s Future, 5(12), 1217–1233.
    Kopp, R. E., Horton, R. M., Little, C. M., Mitrovica, J. X., Oppenheimer, M., Rasmussen, D. J., Strauss, B. H. & Tebaldi, C. (2014). Probabilistic 21st and 22nd Century Sea-Level Projections at a Global Network of Tide-Gauge Sites. Earth’s Future, 2(8), 383–406.
    Kulp, S. A. & Strauss, B. H. (2019). New Elevation Data Triple Estimates of Global Vulnerability to Sea-Level Rise and Coastal Flooding. Nature Communications, 10(1), 4844. Retrieved June 21, 2020, from http://www.nature.com/articles/s41467-019-12808-z
    Muis, S., Verlaan, M., Winsemius, H. C., Aerts, J. C. J. H. & Ward, P. J. (2016). A Global Reanalysis of Storm Surges and Extreme Sea Levels. Nature Communications, 7.

Heavy rains in Rio de Janeiro cause flooding due to poor drainage infrastructure. These can contaminate water reserves, cause landslides, damage buildings and halt city activity. Flood-control plans are under way but they are not ambitious enough to mitigate the combined effects of heavy rainfall and sea level rise.

Earth.Org has mapped the flooding Rio de Janeiro could experience by 2100.

—

In the past year, Rio has experienced exceptionally strong precipitation leading to deadly floods. Aside from direct casualties, the floods put the health of many people at risk, especially those of lower income whose water reserves can be contaminated. Such events can spread disease like gastroenteritis or leptospirosis, along with mosquito-borne illness as these insects benefit from humid conditions. 

In 2012, the city undertook construction of four underground reservoirs and a diversion tunnel for the Joana River to improve flood control. However, these can only accommodate a 1-in-25 years flood, or a flood with a 25% chance of occurring in any given year. 

A recent paper published in Nature estimates that, under high emissions scenarios, global sea levels could rise by an average 1 to 2 meters by 2100. This would certainly increase the occurrence of so-called “100-year floods,” the term used to define a flood that statistically has a 1% chance of occurring in any given year. If one of these surges hit Rio de Janeiro, this is what it would look like.

sea level rise by 2100 Rio de Janeiro

Sea level rise projections by 2100 for two scenarios with the amount of rise in meters indicated (mild = 1m; extreme = 4m). Percentage and total population displacement indicated bottom right.

Methodology

Global mean sea level is projected to rise by 2m at the end of this century. However, in order to determine local sea level rise (SLR), one has to take into account local coastal flood levels which could be 2.8m above Mean Higher-High Water (MHHW) at extreme forecasts. These local levels bring variability to the projected SLR from 1m to 6.5m (eg. Rio vs Kolkata).

The SLR scenarios used in this study are based on the forecasts from Climate Central – Coastal Risk Screening Tool  with the following parameters:

  • Sea level Projection Source
  • Coastal Flood Level
  • Pollution Scenario
  • Luck

Sea level Projection Source: is from two highly cited journals by Kopp et al., estimating SLR mainly due to ocean thermal expansion and ice melt. The mid-range scenario projected 0.5-1.2m of SLR based on different representative concentration pathways (RCP) defined by the IPCC. While the pessimistic scenario added more mechanisms of ice-sheet melting, estimating SLR at 1m-2.5m in 2100, with projection of 10m SLR at 2300.

Coastal Flooding: More frequent coastal flooding is a direct impact of sea-level rise. Based on the Global tides and surge reanalysis by Muis et al., (2016), it is estimated that the extreme coastal water level could be from 0.2 – 2.8m over mean level. While in extreme cases like China and the Netherlands it could experience 5-10m of extreme sea levels. Here, the coastal local flood level is added on top of the projected SLR.

Pollution Scenario: allows to choose the RCP, the greenhouse gas concentration trajectory defined by the IPCC.  The mild level is based on RCP4.5, of 2°C temperature rise; while Extreme level is based on RCP 8.5, of 4°C temperature rise.

Luck: applies to the the baseline SLR, defined in the “Sea level projection” section, upon which we add flooding. “Mild” refers to the mid-range scenario of 0.5-1.2m, and “extreme” to the pessimistic scenario of 1-2.5m. We used the high-end value of each scenario (mild = 1m; extreme = 2.5m).

You might also like: Sea Level Rise by the End of the Century – New York City

References:
  • Kulp, Scott A., and Benjamin H. Strauss. “New elevation data triple estimates of global vulnerability to sea-level rise and coastal flooding.” Nature communications 10.1 (2019): 1-12.
  • Florczyk, A. J., Corbane, C., Ehrlich, D., Freire, S., Kemper, T., Maffenini, L., Melchiorri, M., Politis, P., Schiavina, M., Sabo, F. & Zanchetta, L. (2019). GHSL Data Package 2019 Public Release.
    Kopp, R. E., DeConto, R. M., Bader, D. A., Hay, C. C., Horton, R. M., Kulp, S., Oppenheimer, M., Pollard, D. & Strauss, B. H. (2017). Evolving Understanding of Antarctic Ice-Sheet Physics and Ambiguity in Probabilistic Sea-Level Projections. Earth’s Future, 5(12), 1217–1233.
    Kopp, R. E., Horton, R. M., Little, C. M., Mitrovica, J. X., Oppenheimer, M., Rasmussen, D. J., Strauss, B. H. & Tebaldi, C. (2014). Probabilistic 21st and 22nd Century Sea-Level Projections at a Global Network of Tide-Gauge Sites. Earth’s Future, 2(8), 383–406.
    Kulp, S. A. & Strauss, B. H. (2019). New Elevation Data Triple Estimates of Global Vulnerability to Sea-Level Rise and Coastal Flooding. Nature Communications, 10(1), 4844. Retrieved June 21, 2020, from http://www.nature.com/articles/s41467-019-12808-z
    Muis, S., Verlaan, M., Winsemius, H. C., Aerts, J. C. J. H. & Ward, P. J. (2016). A Global Reanalysis of Storm Surges and Extreme Sea Levels. Nature Communications, 7.

Sea level rise is taken seriously in New York city. According to a survey, 37% of lower Manhattan will be exposed to storm surges by 2050, and official estimates for 2100 have not yet been published. Sea level rise is accelerating and exacerbating the potential for catastrophic flooding as time passes.

Earth.Org has mapped what a severe flood would look like in New York city by 2100.

—

New York’s coastline is a staggering 837 kilometres long. Building defences on such a scale will be a gargantuan task, but one that the city must undertake nonetheless. Low-end estimates for sea level rise by 2100 double the amount of citizens exposed to a 1-in-100 year flood (a flood whose intensity has a 1% chance of occurring in any given year).

The mayor Bill de Blasio announced a USD $10 billion defence plan last year, although the funds aren’t entirely accounted for. Even more doubtful in light of USD $27 million of planned investment for Hurricane Sandy recovery than never came through. 

The plan involves elevating parks, building removal flood barriers, a five-mile seawall around Staten Island and sand bars around the rockaways. The lower tip of Manhattan, most at risk, cannot accommodate flood barriers. The proposed solution is to develop two adjacent blocks of elevated land encapsulating the point and protecting it from future surges.

To better understand why this infrastructure is considered essential, despite the massive costs and onerous nature of the work, Earth.Org has modelled what extreme flooding could look like in New York by 2100.

sea level rise by 2100 New York City

Sea level rise projections by 2100 for two scenarios with the amount of rise in meters indicated (mild = 2m; extreme = 5m). Percentage and total population displacement indicated bottom right.

Methodology

Global mean sea level is projected to rise by 2m at the end of this century. However, in order to determine local sea level rise (SLR), one has to take into account local coastal flood levels which could be 2.8m above Mean Higher-High Water (MHHW) at extreme forecasts. These local levels bring variability to the projected SLR from 1m to 6.5m (eg. Rio vs Kolkata).

The SLR scenarios used in this study are based on the forecasts from Climate Central – Coastal Risk Screening Tool  with the following parameters:

  • Sea level Projection Source
  • Coastal Flood Level
  • Pollution Scenario
  • Luck

Sea level Projection Source: is from two highly cited journals by Kopp et al., estimating SLR mainly due to ocean thermal expansion and ice melt. The mid-range scenario projected 0.5-1.2m of SLR based on different representative concentration pathways (RCP) defined by the IPCC. While the pessimistic scenario added more mechanisms of ice-sheet melting, estimating SLR at 1m-2.5m in 2100, with projection of 10m SLR at 2300.

Coastal Flooding: More frequent coastal flooding is a direct impact of sea-level rise. Based on the Global tides and surge reanalysis by Muis et al., (2016), it is estimated that the extreme coastal water level could be from 0.2 – 2.8m over mean level. While in extreme cases like China and the Netherlands it could experience 5-10m of extreme sea levels. Here, the coastal local flood level is added on top of the projected SLR.

Pollution Scenario: allows to choose the RCP, the greenhouse gas concentration trajectory defined by the IPCC.  The mild level is based on RCP4.5, of 2°C temperature rise; while Extreme level is based on RCP 8.5, of 4°C temperature rise.

Luck: applies to the the baseline SLR, defined in the “Sea level projection” section, upon which we add flooding. “Mild” refers to the mid-range scenario of 0.5-1.2m, and “extreme” to the pessimistic scenario of 1-2.5m. We used the high-end value of each scenario (mild = 1m; extreme = 2.5m).

You might also like: Sea Level Rise by the End of the Century – Shanghai

References:
  • Kulp, Scott A., and Benjamin H. Strauss. “New elevation data triple estimates of global vulnerability to sea-level rise and coastal flooding.” Nature communications 10.1 (2019): 1-12.
  • Florczyk, A. J., Corbane, C., Ehrlich, D., Freire, S., Kemper, T., Maffenini, L., Melchiorri, M., Politis, P., Schiavina, M., Sabo, F. & Zanchetta, L. (2019). GHSL Data Package 2019 Public Release.
  • Kopp, R. E., DeConto, R. M., Bader, D. A., Hay, C. C., Horton, R. M., Kulp, S., Oppenheimer, M., Pollard, D. & Strauss, B. H. (2017). Evolving Understanding of Antarctic Ice-Sheet Physics and Ambiguity in Probabilistic Sea-Level Projections. Earth’s Future, 5(12), 1217–1233.
  • Kopp, R. E., Horton, R. M., Little, C. M., Mitrovica, J. X., Oppenheimer, M., Rasmussen, D. J., Strauss, B. H. & Tebaldi, C. (2014). Probabilistic 21st and 22nd Century Sea-Level Projections at a Global Network of Tide-Gauge Sites. Earth’s Future, 2(8), 383–406.
  • Kulp, S. A. & Strauss, B. H. (2019). New Elevation Data Triple Estimates of Global Vulnerability to Sea-Level Rise and Coastal Flooding. Nature Communications, 10(1), 4844. Retrieved June 21, 2020, from http://www.nature.com/articles/s41467-019-12808-z
  • Muis, S., Verlaan, M., Winsemius, H. C., Aerts, J. C. J. H. & Ward, P. J. (2016). A Global Reanalysis of Storm Surges and Extreme Sea Levels. Nature Communications, 7.

Flooding isn’t unusual in Alexandria, but they are usually triggered by rain. In the past year, the city has suffered from tidal flooding, entirely due to maritime dynamics. This highlights the city’s vulnerability to rising sea levels, and its lack or preparation. 

Earth.Org has mapped what severe flooding could look like in Alexandria by 2100. 

—

After a flash flood that killed seven people in 2015, officials built concrete barriers to reduce coastal flood potential in Alexandria. However, much of the city sits on low-lying grounds that will suffer from coastal flooding if no protective infrastructure is built. Moreover, the compounded effect of climate change is expected to decrease Egypt’s agriculture by 47% by 2060 due to groundwater inundation by salt water. 

In the face of this looming crisis, the Egyptian government claims it is doing everything it can according to an interview by Bloomberg CityLab. An advisor in water resource planning and management to the governor of Alexandria said they “have a lot of protection when it comes to sea-level rise’ but their main focus is trying to prevent floods like that of 2015. 

Their approach is to force residents in poor, vulnerable areas to relocate, often into better housing but with no subsidy for rent. This strategy extends to Egypt as a whole, with plans to construct new cities meant to cost over USD $45 billion and no explicit plan for protecting places like Alexandria and Cairo. 

One of the main issues is a lack of consensus on the gravity of climate change. Many officials do not believe any cities are under immediate threat, a statement that reveals their lack of foresight. 

With no flood control plans or large relocation program for the city of Alexandria the citizens will be left to face the rising sea levels, on top which floods will cause devastating damage. Earth.Org has modelled what such a flood could look like by 2100.

sea level rise Alexandria 2100 end of century

Sea level rise projections by 2100 for two scenarios with the amount of rise in meters indicated (mild = 1m; extreme = 3m). Percentage and total population displacement indicated bottom right.

Methodology

Global mean sea level is projected to rise by 2m at the end of this century. However, in order to determine local sea level rise (SLR), one has to take into account local coastal flood levels which could be 2.8m above Mean Higher-High Water (MHHW) at extreme forecasts. These local levels bring variability to the projected SLR from 1m to 6.5m (eg. Rio vs Kolkata).

The SLR scenarios used in this study are based on the forecasts from Climate Central – Coastal Risk Screening Tool  with the following parameters:

  • Sea level Projection Source
  • Coastal Flood Level
  • Pollution Scenario
  • Luck

Sea level Projection Source: is from two highly cited journals by Kopp et al., estimating SLR mainly due to ocean thermal expansion and ice melt. The mid-range scenario projected 0.5-1.2m of SLR based on different representative concentration pathways (RCP) defined by the IPCC. While the pessimistic scenario added more mechanisms of ice-sheet melting, estimating SLR at 1m-2.5m in 2100, with projection of 10m SLR at 2300.

Coastal Flooding: More frequent coastal flooding is a direct impact of sea-level rise. Based on the Global tides and surge reanalysis by Muis et al., (2016), it is estimated that the extreme coastal water level could be from 0.2 – 2.8m over mean level. While in extreme cases like China and the Netherlands it could experience 5-10m of extreme sea levels. Here, the coastal local flood level is added on top of the projected SLR.

Pollution Scenario: allows to choose the RCP, the greenhouse gas concentration trajectory defined by the IPCC.  The mild level is based on RCP4.5, of 2°C temperature rise; while Extreme level is based on RCP 8.5, of 4°C temperature rise.

Luck: applies to the the baseline SLR, defined in the “Sea level projection” section, upon which we add flooding. “Mild” refers to the mid-range scenario of 0.5-1.2m, and “extreme” to the pessimistic scenario of 1-2.5m. We used the high-end value of each scenario (mild = 1m; extreme = 2.5m).

You might also like: Sea Level Rise by the End of the Century – Guangzhou

References:
  • Kulp, Scott A., and Benjamin H. Strauss. “New elevation data triple estimates of global vulnerability to sea-level rise and coastal flooding.” Nature communications 10.1 (2019): 1-12.
  • Florczyk, A. J., Corbane, C., Ehrlich, D., Freire, S., Kemper, T., Maffenini, L., Melchiorri, M., Politis, P., Schiavina, M., Sabo, F. & Zanchetta, L. (2019). GHSL Data Package 2019 Public Release.
  • Kopp, R. E., DeConto, R. M., Bader, D. A., Hay, C. C., Horton, R. M., Kulp, S., Oppenheimer, M., Pollard, D. & Strauss, B. H. (2017). Evolving Understanding of Antarctic Ice-Sheet Physics and Ambiguity in Probabilistic Sea-Level Projections. Earth’s Future, 5(12), 1217–1233.
  • Kopp, R. E., Horton, R. M., Little, C. M., Mitrovica, J. X., Oppenheimer, M., Rasmussen, D. J., Strauss, B. H. & Tebaldi, C. (2014). Probabilistic 21st and 22nd Century Sea-Level Projections at a Global Network of Tide-Gauge Sites. Earth’s Future, 2(8), 383–406.
  • Kulp, S. A. & Strauss, B. H. (2019). New Elevation Data Triple Estimates of Global Vulnerability to Sea-Level Rise and Coastal Flooding. Nature Communications, 10(1), 4844. Retrieved June 21, 2020, from http://www.nature.com/articles/s41467-019-12808-z
  • Muis, S., Verlaan, M., Winsemius, H. C., Aerts, J. C. J. H. & Ward, P. J. (2016). A Global Reanalysis of Storm Surges and Extreme Sea Levels. Nature Communications, 7.

Kolkata (also known as Calcutta), built around the Hooghly River, is highly vulnerable to flooding from the monsoon rainfall between June and September. While these bring life to a stall, the city can cope. Cyclones however, like Amphan that came through in May 2020, cause devastating damage and cost many lives. 

A less prominent yet imminent threat is that of sea level rise, expected to fully engulf the city by 2100. Earth.Org has mapped what rising sea levels could lead to in Kolkata.

—

The city of Kolkata is home to 14 million people, making it the third largest agglomeration in India. It underwent rapid industrial expansion from the 1850s onward, but its infrastructure was destroyed by Japanese air strikes during World War II, then by a violent Marxist-Maoist movement called the Naxalites in the 1970s. The IT industry has revived the city but the disorganization of its expansion has left many vulnerable to natural disasters. 

Built on the lower Ganges Delta in what used to be wetlands, the water-logged region makes this low-lying city particularly vulnerable to flooding. Elevation varies from 1.5 meters to 11 meters above sea level, but there are also many natural depressions and a malleable clay layer beneath. Moreover, the drainage system in Kolkata may be one of the oldest in India. The poor economic history of the city has led to poor infrastructure maintenance and city planning, leading to clogged and unsanitary sewage, and sub-optimal canal design. 

As sea levels continue to rise, a normal flood’s impact will be amplified enough to cause serious real estate and infrastructural damage. Worse yet, a 1-in-100 year flood (whose intensity has a 1% chance of occurring in any given year), most probably driven by a storm surge, could kill hundreds if not thousands and majorly disrupt economic activity.

Mitigation would require a gargantuan effort, either by building defences or elevating vulnerable parts of the city. Earth.Org has modelled what a 1-in-100 year flood would look like by 2100 in the absence of preventive measures. 

sea level rise by 2100 kolkata

Sea level rise projections by 2100 for two scenarios with the amount of rise in meters indicated (mild = 3m; extreme = 6m). Percentage and total population displacement indicated bottom right.

Methodology

Global mean sea level is projected to rise by 2m at the end of this century. However, in order to determine local sea level rise (SLR), one has to take into account local coastal flood levels which could be 2.8m above Mean Higher-High Water (MHHW) at extreme forecasts. These local levels bring variability to the projected SLR from 1m to 6.5m (eg. Rio vs Kolkata).

The SLR scenarios used in this study are based on the forecasts from Climate Central – Coastal Risk Screening Tool  with the following parameters:

  • Sea level Projection Source
  • Coastal Flood Level
  • Pollution Scenario
  • Luck

Sea level Projection Source: is from two highly cited journals by Kopp et al., estimating SLR mainly due to ocean thermal expansion and ice melt. The mid-range scenario projected 0.5-1.2m of SLR based on different representative concentration pathways (RCP) defined by the IPCC. While the pessimistic scenario added more mechanisms of ice-sheet melting, estimating SLR at 1m-2.5m in 2100, with projection of 10m SLR at 2300.

Coastal Flooding: More frequent coastal flooding is a direct impact of sea-level rise. Based on the Global tides and surge reanalysis by Muis et al., (2016), it is estimated that the extreme coastal water level could be from 0.2 – 2.8m over mean level. While in extreme cases like China and the Netherlands it could experience 5-10m of extreme sea levels. Here, the coastal local flood level is added on top of the projected SLR.

Pollution Scenario: allows to choose the RCP, the greenhouse gas concentration trajectory defined by the IPCC.  The mild level is based on RCP4.5, of 2°C temperature rise; while Extreme level is based on RCP 8.5, of 4°C temperature rise.

Luck: applies to the the baseline SLR, defined in the “Sea level projection” section, upon which we add flooding. “Mild” refers to the mid-range scenario of 0.5-1.2m, and “extreme” to the pessimistic scenario of 1-2.5m. We used the high-end value of each scenario (mild = 1m; extreme = 2.5m).

References:
  • Kulp, Scott A., and Benjamin H. Strauss. “New elevation data triple estimates of global vulnerability to sea-level rise and coastal flooding.” Nature communications 10.1 (2019): 1-12.
  • Florczyk, A. J., Corbane, C., Ehrlich, D., Freire, S., Kemper, T., Maffenini, L., Melchiorri, M., Politis, P., Schiavina, M., Sabo, F. & Zanchetta, L. (2019). GHSL Data Package 2019 Public Release.
  • Kopp, R. E., DeConto, R. M., Bader, D. A., Hay, C. C., Horton, R. M., Kulp, S., Oppenheimer, M., Pollard, D. & Strauss, B. H. (2017). Evolving Understanding of Antarctic Ice-Sheet Physics and Ambiguity in Probabilistic Sea-Level Projections. Earth’s Future, 5(12), 1217–1233.
  • Kopp, R. E., Horton, R. M., Little, C. M., Mitrovica, J. X., Oppenheimer, M., Rasmussen, D. J., Strauss, B. H. & Tebaldi, C. (2014). Probabilistic 21st and 22nd Century Sea-Level Projections at a Global Network of Tide-Gauge Sites. Earth’s Future, 2(8), 383–406.
  • Kulp, S. A. & Strauss, B. H. (2019). New Elevation Data Triple Estimates of Global Vulnerability to Sea-Level Rise and Coastal Flooding. Nature Communications, 10(1), 4844. Retrieved June 21, 2020, from http://www.nature.com/articles/s41467-019-12808-z
  • Muis, S., Verlaan, M., Winsemius, H. C., Aerts, J. C. J. H. & Ward, P. J. (2016). A Global Reanalysis of Storm Surges and Extreme Sea Levels. Nature Communications, 7.

During the rainy season, from May to October, Ho Chi Minh experiences regular flooding. A combination of high tides, heavy rains, overflow in the Saigon and Dong Nai rivers and land subsidence puts the city in the top 10 most vulnerable to sea level rise. 

Earth.Org has mapped what a severe flood could look like in Ho Chi Minh by 2100. 

—

Flooding is a common part of life in Ho Chi Minh city. 40 to 45% of the city stands less than a meter above sea level and land subsidence due to rapid groundwater extraction is making this worse. Record breaking river tides, reaching 1.77 metres, are increasingly frequent because tide-draining swamps have been filled up to build housing. 

A 1-in-100 year flood (whose intensity has a 1% chance of occurring in any given year) could cause hundreds of millions of US dollars in infrastructure damage and up to USD $1.5 billion in real estate damage. A recent paper published in Nature estimates that, under high emissions scenarios, global sea levels could rise by an average 1 to 2 meters by 2100. This phenomenon could put a large part of the city under water without any kind of water surge, meaning that a 1-in-100 year flood would be disastrous.

A 2017 study states that such an event would cost USD $7.8 billion in infrastructure damage and $18 billion in real estate costs. The knock-on effects of the city’s shutdown were estimated at $45 billion, or a fifth of Vietnam’s GDP.  Earth.Org has modelled what such a flood would result in by 2100.

Sea level rise by 2100 Ho Chi Minh

Sea level rise projections by 2100 for two scenarios with the amount of rise in meters indicated (mild = 2m; extreme = 4m). Percentage and total population displacement indicated bottom right.

Sea Level Rise Methodology

Global mean sea level is projected to rise by 2m at the end of this century. However, in order to determine local sea level rise (SLR), one has to take into account local coastal flood levels which could be 2.8m above Mean Higher-High Water (MHHW) at extreme forecasts. These local levels bring variability to the projected SLR from 1m to 6.5m (eg. Rio vs Kolkata).

The SLR scenarios used in this study are based on the forecasts from Climate Central – Coastal Risk Screening Tool  with the following parameters:

  • Sea level Projection Source
  • Coastal Flood Level
  • Pollution Scenario
  • Luck

Sea level Projection Source: is from two highly cited journals by Kopp et al., estimating SLR mainly due to ocean thermal expansion and ice melt. The mid-range scenario projected 0.5-1.2m of SLR based on different representative concentration pathways (RCP) defined by the IPCC. While the pessimistic scenario added more mechanisms of ice-sheet melting, estimating SLR at 1m-2.5m in 2100, with projection of 10m SLR at 2300.

Coastal Flooding: More frequent coastal flooding is a direct impact of sea-level rise. Based on the Global tides and surge reanalysis by Muis et al., (2016), it is estimated that the extreme coastal water level could be from 0.2 – 2.8m over mean level. While in extreme cases like China and the Netherlands it could experience 5-10m of extreme sea levels. Here, the coastal local flood level is added on top of the projected SLR.

Pollution Scenario: allows to choose the RCP, the greenhouse gas concentration trajectory defined by the IPCC.  The mild level is based on RCP4.5, of 2°C temperature rise; while Extreme level is based on RCP 8.5, of 4°C temperature rise.

Luck: applies to the the baseline SLR, defined in the “Sea level projection” section, upon which we add flooding. “Mild” refers to the mid-range scenario of 0.5-1.2m, and “extreme” to the pessimistic scenario of 1-2.5m. We used the high-end value of each scenario (mild = 1m; extreme = 2.5m).

References:
  • Kulp, Scott A., and Benjamin H. Strauss. “New elevation data triple estimates of global vulnerability to sea-level rise and coastal flooding.” Nature communications 10.1 (2019): 1-12.
  • Florczyk, A. J., Corbane, C., Ehrlich, D., Freire, S., Kemper, T., Maffenini, L., Melchiorri, M., Politis, P., Schiavina, M., Sabo, F. & Zanchetta, L. (2019). GHSL Data Package 2019 Public Release.
  • Kopp, R. E., DeConto, R. M., Bader, D. A., Hay, C. C., Horton, R. M., Kulp, S., Oppenheimer, M., Pollard, D. & Strauss, B. H. (2017). Evolving Understanding of Antarctic Ice-Sheet Physics and Ambiguity in Probabilistic Sea-Level Projections. Earth’s Future, 5(12), 1217–1233.
  • Kopp, R. E., Horton, R. M., Little, C. M., Mitrovica, J. X., Oppenheimer, M., Rasmussen, D. J., Strauss, B. H. & Tebaldi, C. (2014). Probabilistic 21st and 22nd Century Sea-Level Projections at a Global Network of Tide-Gauge Sites. Earth’s Future, 2(8), 383–406
  • Kulp, S. A. & Strauss, B. H. (2019). New Elevation Data Triple Estimates of Global Vulnerability to Sea-Level Rise and Coastal Flooding. Nature Communications, 10(1), 4844. Retrieved June 21, 2020, from http://www.nature.com/articles/s41467-019-12808-z
  • Muis, S., Verlaan, M., Winsemius, H. C., Aerts, J. C. J. H. & Ward, P. J. (2016). A Global Reanalysis of Storm Surges and Extreme Sea Levels. Nature Communications, 7.
  • Scussolini, Paolo, et al. “Adaptation to sea level rise: a multidisciplinary analysis for Ho Chi Minh City, Vietnam.” Water Resources Research 53.12 (2017): 10841-10857.

Mumbai has been declared one of the most vulnerable cities to climate change due to its high population density, economic importance and flood-proneness. Rising sea levels will worsen the effects of severe flooding, like the 2005 Maharashtra episode that caused a direct loss of USD $100 million, with many more knock-on costs.

Earth.Org has mapped what extreme water surges could look like in Mumbai by 2100.

—

Climate change is already affecting the central belt of India from Mumbai to Bhubaneshwar, as demonstrated by the three-fold increase in heavy rainfall events from 1901 to 2015. These can sometimes last for 2 to 3 days and paralyse cities for even longer. This is due to antiquated drainage systems, much like in Kolkata. Mumbai storm-drainage was set up in the early 1900s with a maximum throughput of 25 millimetres per hour. Highly insufficient for dealing with downpours reaching 993 millimetres in 24 hours. 

Like other Indian and South-East Asian countries, Mumbai suffers from uncontrolled, unplanned development, especially in its northern suburbs. This means poorly designed drainage plans that accommodate a small area but don’t function on a city-wide scale. The city is therefore unequipped to deal with exceptionally strong floods. 

An ambitious plan was commissioned by the Brihanmumbai Municipal Corporation in 1990, meant to overhaul the drainage system but it was rejected for being too costly (6 billion rupee, USD $800 million). It is indeed a huge sum, but is it a necessary cost? A recent paper published in Nature estimates that, under high emissions scenarios, global sea levels could rise by an average 1 to 2 meters by 2100. Combined with a severe downpour, a flood like the one below could hit Mumbai.

sea level rise by 2100 mumbai

Sea level rise projections by 2100 for two scenarios with the amount of rise in meters indicated (mild = 3m; extreme = 5m). Percentage and total population displacement indicated bottom right.

Methodology

Global mean sea level is projected to rise by 2m at the end of this century. However, in order to determine local sea level rise (SLR), one has to take into account local coastal flood levels which could be 2.8m above Mean Higher-High Water (MHHW) at extreme forecasts. These local levels bring variability to the projected SLR from 1m to 6.5m (eg. Rio vs Kolkata).

The SLR scenarios used in this study are based on the forecasts from Climate Central – Coastal Risk Screening Tool  with the following parameters:

  • Sea level Projection Source
  • Coastal Flood Level
  • Pollution Scenario
  • Luck

Sea level Projection Source: is from two highly cited journals by Kopp et al., estimating SLR mainly due to ocean thermal expansion and ice melt. The mid-range scenario projected 0.5-1.2m of SLR based on different representative concentration pathways (RCP) defined by the IPCC. While the pessimistic scenario added more mechanisms of ice-sheet melting, estimating SLR at 1m-2.5m in 2100, with projection of 10m SLR at 2300.

Coastal Flooding: More frequent coastal flooding is a direct impact of sea-level rise. Based on the Global tides and surge reanalysis by Muis et al., (2016), it is estimated that the extreme coastal water level could be from 0.2 – 2.8m over mean level. While in extreme cases like China and the Netherlands it could experience 5-10m of extreme sea levels. Here, the coastal local flood level is added on top of the projected SLR.

Pollution Scenario: allows to choose the RCP, the greenhouse gas concentration trajectory defined by the IPCC.  The mild level is based on RCP4.5, of 2°C temperature rise; while Extreme level is based on RCP 8.5, of 4°C temperature rise.

Luck: applies to the the baseline SLR, defined in the “Sea level projection” section, upon which we add flooding. “Mild” refers to the mid-range scenario of 0.5-1.2m, and “extreme” to the pessimistic scenario of 1-2.5m. We used the high-end value of each scenario (mild = 1m; extreme = 2.5m).

References:
  • Kulp, Scott A., and Benjamin H. Strauss. “New elevation data triple estimates of global vulnerability to sea-level rise and coastal flooding.” Nature communications 10.1 (2019): 1-12.
  • Florczyk, A. J., Corbane, C., Ehrlich, D., Freire, S., Kemper, T., Maffenini, L., Melchiorri, M., Politis, P., Schiavina, M., Sabo, F. & Zanchetta, L. (2019). GHSL Data Package 2019 Public Release.
  • Kopp, R. E., DeConto, R. M., Bader, D. A., Hay, C. C., Horton, R. M., Kulp, S., Oppenheimer, M., Pollard, D. & Strauss, B. H. (2017). Evolving Understanding of Antarctic Ice-Sheet Physics and Ambiguity in Probabilistic Sea-Level Projections. Earth’s Future, 5(12), 1217–1233.
  • Kopp, R. E., Horton, R. M., Little, C. M., Mitrovica, J. X., Oppenheimer, M., Rasmussen, D. J., Strauss, B. H. & Tebaldi, C. (2014). Probabilistic 21st and 22nd Century Sea-Level Projections at a Global Network of Tide-Gauge Sites. Earth’s Future, 2(8), 383–406.
  • Kulp, S. A. & Strauss, B. H. (2019). New Elevation Data Triple Estimates of Global Vulnerability to Sea-Level Rise and Coastal Flooding. Nature Communications, 10(1), 4844. Retrieved June 21, 2020, from http://www.nature.com/articles/s41467-019-12808-z
  • Muis, S., Verlaan, M., Winsemius, H. C., Aerts, J. C. J. H. & Ward, P. J. (2016). A Global Reanalysis of Storm Surges and Extreme Sea Levels. Nature Communications, 7.

Dhaka, the most populous city of Bangladesh, sits on the Ganges River Delta, a massive wetland spilling into the Bay of Bengal. Severe flooding events are becoming more frequent and water sources are contaminated. The added pressure of sea level rise will force the people of Dhaka to adapt, putting more financial burden on a country with few resources. 

Earth.org has mapped what extreme flooding could look like in Dhaka by the end of the century. 

—

Dhaka is the financial and commercial capital of Bangladesh, accounting for 35% of its economic activity. Bounded by the Buriganga, Turag, Daleshwari and Shitalakshya Rivers, it was once called the “Venice of the East”. The original settlement was concentrated on heights, like the Madhupur terrace, but newer districts are now built on flood-prone areas. 

Natural channels used to form a natural drainage network throughout the city, warranting its title of “Venice of the East”, or “City of Channels”. Leading to the surrounding rivers, these depressions were vital to draining excess downpour out of Dhaka. However, exceptionally severe floods in 1988 and 1998, along with a population explosion from 2 to 8 million inhabitants, changed the river-harmonious city planning into attempts to control the environment. Dams and embankments were built for flood protection, cutting off lower wetlands while the remaining water bodies were filled to accommodate urban expansion. 

Having done away with natural drainage systems, today’s artificial flood control systems are barely sufficient, and water reserves are contaminated with disease and industrial waste. Rising sea levels must be prepared against, but poor city planning and continual expansion makes it difficult to adapt.

In order to illustrate the looming threat, Earth.Org has modelled what strong flooding would look like when combined with sea level rise by the year 2100.

Dhaka sea level rise 2100

Sea level rise projections by 2100 for two scenarios with the amount of rise in meters indicated (mild = 3m; extreme = 5m). Percentage and total population displacement indicated bottom right.

Methodology

Global mean sea level is projected to rise by 2m at the end of this century. However, in order to determine local sea level rise (SLR), one has to take into account local coastal flood levels which could be 2.8m above Mean Higher-High Water (MHHW) at extreme forecasts. These local levels bring variability to the projected SLR from 1m to 6.5m (eg. Rio vs Kolkata).

The SLR scenarios used in this study are based on the forecasts from Climate Central – Coastal Risk Screening Tool  with the following parameters:

  • Sea level Projection Source
  • Coastal Flood Level
  • Pollution Scenario
  • Luck

Sea level Projection Source: is from two highly cited journals by Kopp et al., estimating SLR mainly due to ocean thermal expansion and ice melt. The mid-range scenario projected 0.5-1.2m of SLR based on different representative concentration pathways (RCP) defined by the IPCC. While the pessimistic scenario added more mechanisms of ice-sheet melting, estimating SLR at 1m-2.5m in 2100, with projection of 10m SLR at 2300.

Coastal Flooding: More frequent coastal flooding is a direct impact of sea-level rise. Based on the Global tides and surge reanalysis by Muis et al., (2016), it is estimated that the extreme coastal water level could be from 0.2 – 2.8m over mean level. While in extreme cases like China and the Netherlands it could experience 5-10m of extreme sea levels. Here, the coastal local flood level is added on top of the projected SLR.

Pollution Scenario: allows to choose the RCP, the greenhouse gas concentration trajectory defined by the IPCC.  The mild level is based on RCP4.5, of 2°C temperature rise; while Extreme level is based on RCP 8.5, of 4°C temperature rise.

Luck: applies to the the baseline SLR, defined in the “Sea level projection” section, upon which we add flooding. “Mild” refers to the mid-range scenario of 0.5-1.2m, and “extreme” to the pessimistic scenario of 1-2.5m. We used the high-end value of each scenario (mild = 1m; extreme = 2.5m).

References:
  • Kulp, Scott A., and Benjamin H. Strauss. “New elevation data triple estimates of global vulnerability to sea-level rise and coastal flooding.” Nature communications 10.1 (2019): 1-12.
  • Florczyk, A. J., Corbane, C., Ehrlich, D., Freire, S., Kemper, T., Maffenini, L., Melchiorri, M., Politis, P., Schiavina, M., Sabo, F. & Zanchetta, L. (2019). GHSL Data Package 2019 Public Release.
  • Kopp, R. E., DeConto, R. M., Bader, D. A., Hay, C. C., Horton, R. M., Kulp, S., Oppenheimer, M., Pollard, D. & Strauss, B. H. (2017). Evolving Understanding of Antarctic Ice-Sheet Physics and Ambiguity in Probabilistic Sea-Level Projections. Earth’s Future, 5(12), 1217–1233.
  • Kopp, R. E., Horton, R. M., Little, C. M., Mitrovica, J. X., Oppenheimer, M., Rasmussen, D. J., Strauss, B. H. & Tebaldi, C. (2014). Probabilistic 21st and 22nd Century Sea-Level Projections at a Global Network of Tide-Gauge Sites. Earth’s Future, 2(8), 383–406.
  • Kulp, S. A. & Strauss, B. H. (2019). New Elevation Data Triple Estimates of Global Vulnerability to Sea-Level Rise and Coastal Flooding. Nature Communications, 10(1), 4844. Retrieved June 21, 2020, from http://www.nature.com/articles/s41467-019-12808-z
  • Muis, S., Verlaan, M., Winsemius, H. C., Aerts, J. C. J. H. & Ward, P. J. (2016). A Global Reanalysis of Storm Surges and Extreme Sea Levels. Nature Communications, 7.
  • Hough, M. (2006). Cities and natural process: A basis for sustainability. London: Routledge.

Osaka, like much of Japan, is highly vulnerable to natural disasters. From wind and rain typhoons to earthquakes and tsunamis, the Japanese government spares no effort on flood defence. Sea level rise means scientists must reevaluate their current strategies. 

Earth.Org has mapped what severe flooding could look like in Osaka by 2100. 

—

Osaka has been an important economic hub in Japan since the year 300, and is the second largest metropolitan area in the country today with 20 million inhabitants. According to a 2008 OECD report, Osaka is one the most vulnerable port cities in the world, risking USD $200 billion in damage from coastal flooding. 

Sitting on low-lying flatlands, Osaka was reminded of its exposure to paralysing floods on September 4th, 2018 as typhoon Jebi made landfall. 11 people were killed and 700 more injured while a massive oil tanker crashed into a bridge, and the Kansai international airport was flooded.  

The Japanese are no strangers to natural disaster, having dealt with some of the worst earthquakes, tsunamis and heavy flooding. Their flood defence systems are carefully built based on scientific models, but these must be updated to keep up with recent advances. The dykes and flood gates on the Yodo River, which runs through the city, can withstand a 1-in-200 year flood (whose intensity has a 0.5% chance occurring in any given year). However, sea level rise is changing the baseline, and will eventually shift a 1-in-200 to a 1-in-100 and so on. 

Japan wrote a law in 2015 requesting municipalities to prepare for 1-in-1000 year scenarios, before the latest reports predicting a 1 to 2 metre rise in sea level. The costs will be huge, but the alternative could cost even more, adding the financial to the human cost. Earth.Org has modelled what severe flooding would look like in Osaka by 2100, to illustrate the extreme necessity of prevention. 

sea level rise by 2100 Osaka

Methodology

Global mean sea level is projected to rise by 2m at the end of this century. However, in order to determine local sea level rise (SLR), one has to take into account local coastal flood levels which could be 2.8m above Mean Higher-High Water (MHHW) at extreme forecasts. These local levels bring variability to the projected SLR from 1m to 6.5m (eg. Rio vs Kolkata).

The SLR scenarios used in this study are based on the forecasts from Climate Central – Coastal Risk Screening Tool  with the following parameters:

  • Sea level Projection Source
  • Coastal Flood Level
  • Pollution Scenario
  • Luck

Sea level Projection Source: is from two highly cited journals by Kopp et al., estimating SLR mainly due to ocean thermal expansion and ice melt. The mid-range scenario projected 0.5-1.2m of SLR based on different representative concentration pathways (RCP) defined by the IPCC. While the pessimistic scenario added more mechanisms of ice-sheet melting, estimating SLR at 1m-2.5m in 2100, with projection of 10m SLR at 2300.

Coastal Flooding: More frequent coastal flooding is a direct impact of sea-level rise. Based on the Global tides and surge reanalysis by Muis et al., (2016), it is estimated that the extreme coastal water level could be from 0.2 – 2.8m over mean level. While in extreme cases like China and the Netherlands it could experience 5-10m of extreme sea levels. Here, the coastal local flood level is added on top of the projected SLR.

Pollution Scenario: allows to choose the RCP, the greenhouse gas concentration trajectory defined by the IPCC.  The mild level is based on RCP4.5, of 2°C temperature rise; while Extreme level is based on RCP 8.5, of 4°C temperature rise.

Luck: applies to the the baseline SLR, defined in the “Sea level projection” section, upon which we add flooding. “Mild” refers to the mid-range scenario of 0.5-1.2m, and “extreme” to the pessimistic scenario of 1-2.5m. We used the high-end value of each scenario (mild = 1m; extreme = 2.5m).

References:
  • Kulp, Scott A., and Benjamin H. Strauss. “New elevation data triple estimates of global vulnerability to sea-level rise and coastal flooding.” Nature communications 10.1 (2019): 1-12.
  • Florczyk, A. J., Corbane, C., Ehrlich, D., Freire, S., Kemper, T., Maffenini, L., Melchiorri, M., Politis, P., Schiavina, M., Sabo, F. & Zanchetta, L. (2019). GHSL Data Package 2019 Public Release.
  • Kopp, R. E., DeConto, R. M., Bader, D. A., Hay, C. C., Horton, R. M., Kulp, S., Oppenheimer, M., Pollard, D. & Strauss, B. H. (2017). Evolving Understanding of Antarctic Ice-Sheet Physics and Ambiguity in Probabilistic Sea-Level Projections. Earth’s Future, 5(12), 1217–1233.
  • Kopp, R. E., Horton, R. M., Little, C. M., Mitrovica, J. X., Oppenheimer, M., Rasmussen, D. J., Strauss, B. H. & Tebaldi, C. (2014). Probabilistic 21st and 22nd Century Sea-Level Projections at a Global Network of Tide-Gauge Sites. Earth’s Future, 2(8), 383–406.
  • Kulp, S. A. & Strauss, B. H. (2019). New Elevation Data Triple Estimates of Global Vulnerability to Sea-Level Rise and Coastal Flooding. Nature Communications, 10(1), 4844. Retrieved June 21, 2020, from http://www.nature.com/articles/s41467-019-12808-z
  • Muis, S., Verlaan, M., Winsemius, H. C., Aerts, J. C. J. H. & Ward, P. J. (2016). A Global Reanalysis of Storm Surges and Extreme Sea Levels. Nature Communications, 7.

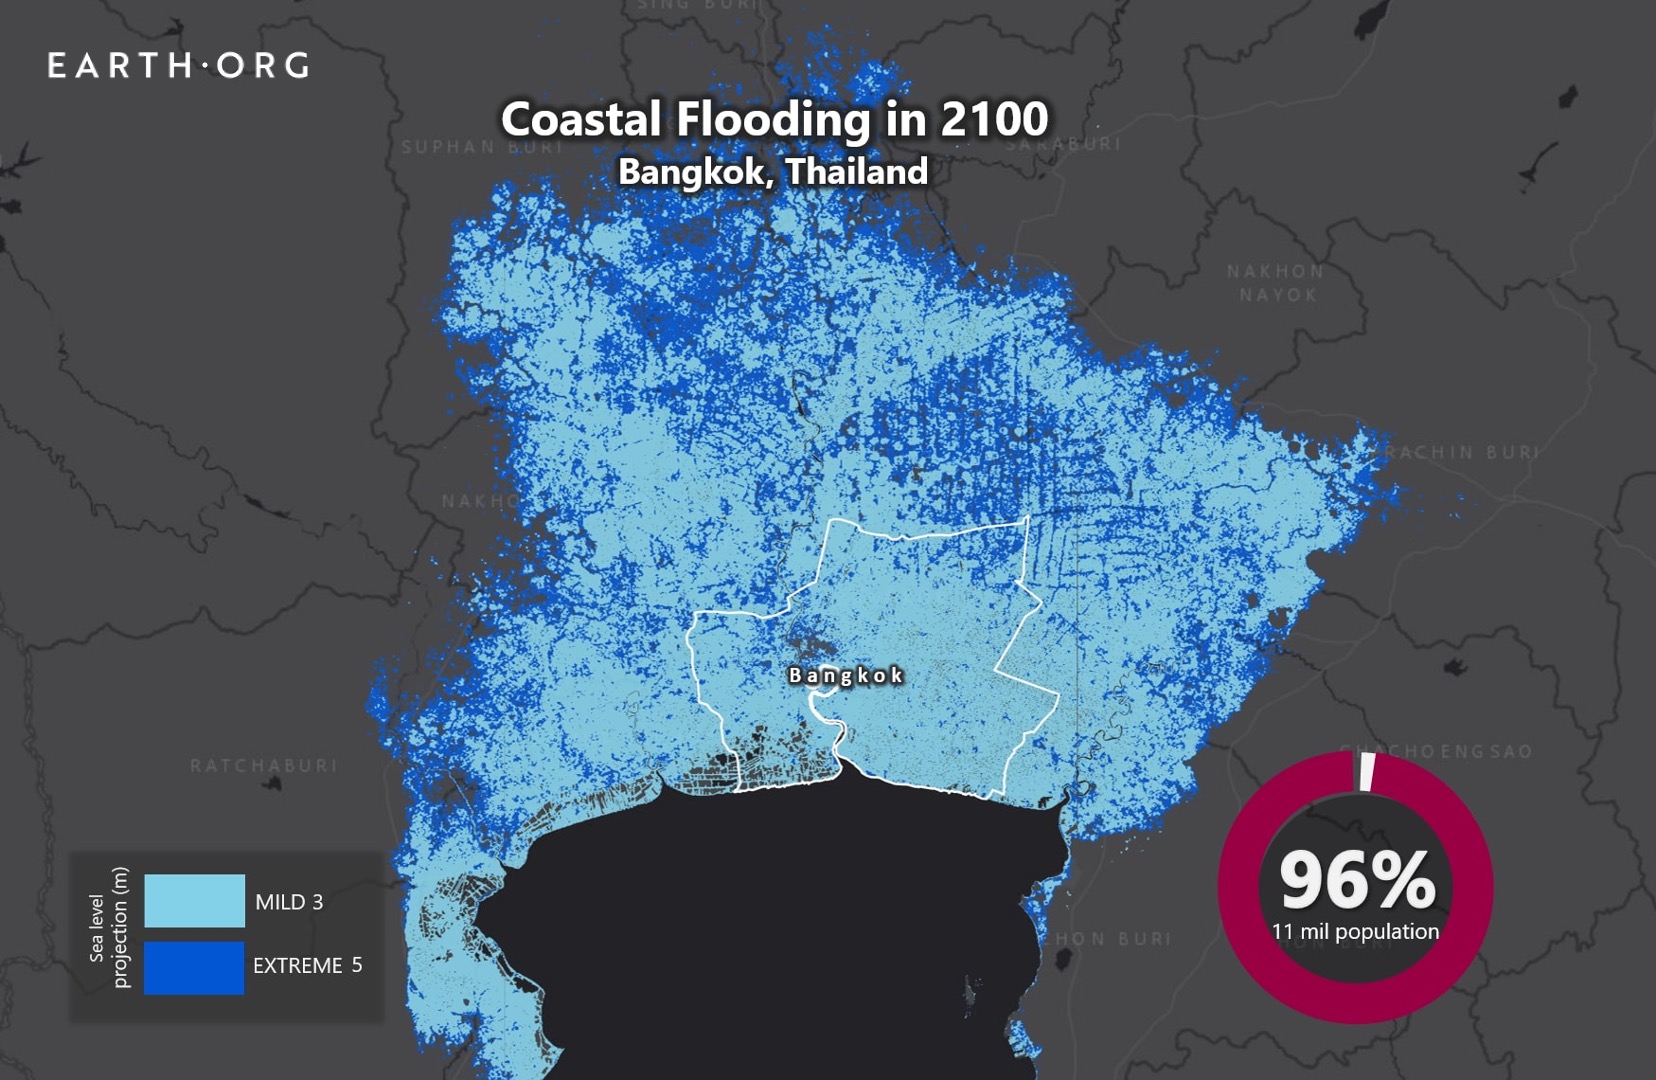
Built on the Chao Phraya River delta in Thailand’s central plain, Bangkok is a low-lying city with an average elevation of 1.5 metres above sea level. Sea level rise alone, expected to reach 1 to 2 metres, will submerge most of the city by the end of the century. Disruptive floods will become catastrophic events, putting lives and infrastructure in danger, and costing a great deal to adapt to. 

Earth.Org has mapped severe flooding in Bangkok by 2100 to illustrate the impending danger. 

—

Bangkok lies on what used to be an extensive swampland. The water-logged area was drained to accommodate for agriculture, and then urban expansion. It sits a layer of soft clay known as “Bangkok clay”, around 15 metres thick and housing beneath it a large groundwater reservoir. Like many other Asian cities, excessive extraction is causing alarming subsidence, whose rates reached 120 millimetres per year in 1981 (4.7 inches). This has been slowed thanks to more mindful practices, but parts of the city are now 1 metre below sea level. 

Torrential rains readily fill up these lower areas, and poor drainage systems do little to mitigate severe flooding events that can persist for up to two months. Despite some effort to improve infrastructure, not enough is being done. A study by the OECD estimated that 5 out of the 10 million people living in Bangkok would be exposed to flood risk by 2070. Since then, the sixth IPCC Assessment Report is coming through with even more alarming projections for the end of the century.  

If Thailand’s government is to avoid dire consequences, they must act now. A sense of urgency has settled on the population and officials alike, but a concrete plan has yet to be put forward. Earth.Org has modelled severe flooding on top of sea level rise by 2100 to illustrate the need for action. 

sea level rise by 2100 bangkok

Sea level rise projections by 2100 for two scenarios with the amount of rise in meters indicated (mild = 3m; extreme = 5m). Percentage and total population displacement indicated bottom right.

Methodology

Global mean sea level is projected to rise by 2m at the end of this century. However, in order to determine local sea level rise (SLR), one has to take into account local coastal flood levels which could be 2.8m above Mean Higher-High Water (MHHW) at extreme forecasts. These local levels bring variability to the projected SLR from 1m to 6.5m (eg. Rio vs Kolkata).

The SLR scenarios used in this study are based on the forecasts from Climate Central – Coastal Risk Screening Tool  with the following parameters:

  • Sea level Projection Source
  • Coastal Flood Level
  • Pollution Scenario
  • Luck

Sea level Projection Source: is from two highly cited journals by Kopp et al., estimating SLR mainly due to ocean thermal expansion and ice melt. The mid-range scenario projected 0.5-1.2m of SLR based on different representative concentration pathways (RCP) defined by the IPCC. While the pessimistic scenario added more mechanisms of ice-sheet melting, estimating SLR at 1m-2.5m in 2100, with projection of 10m SLR at 2300.

Coastal Flooding: More frequent coastal flooding is a direct impact of sea-level rise. Based on the Global tides and surge reanalysis by Muis et al., (2016), it is estimated that the extreme coastal water level could be from 0.2 – 2.8m over mean level. While in extreme cases like China and the Netherlands it could experience 5-10m of extreme sea levels. Here, the coastal local flood level is added on top of the projected SLR.

Pollution Scenario: allows to choose the RCP, the greenhouse gas concentration trajectory defined by the IPCC.  The mild level is based on RCP4.5, of 2°C temperature rise; while Extreme level is based on RCP 8.5, of 4°C temperature rise.

Luck: applies to the the baseline SLR, defined in the “Sea level projection” section, upon which we add flooding. “Mild” refers to the mid-range scenario of 0.5-1.2m, and “extreme” to the pessimistic scenario of 1-2.5m. We used the high-end value of each scenario (mild = 1m; extreme = 2.5m).

References:
  • Kulp, Scott A., and Benjamin H. Strauss. “New elevation data triple estimates of global vulnerability to sea-level rise and coastal flooding.” Nature communications 10.1 (2019): 1-12.
  • Florczyk, A. J., Corbane, C., Ehrlich, D., Freire, S., Kemper, T., Maffenini, L., Melchiorri, M., Politis, P., Schiavina, M., Sabo, F. & Zanchetta, L. (2019). GHSL Data Package 2019 Public Release.
  • Kopp, R. E., DeConto, R. M., Bader, D. A., Hay, C. C., Horton, R. M., Kulp, S., Oppenheimer, M., Pollard, D. & Strauss, B. H. (2017). Evolving Understanding of Antarctic Ice-Sheet Physics and Ambiguity in Probabilistic Sea-Level Projections. Earth’s Future, 5(12), 1217–1233.
  • Kopp, R. E., Horton, R. M., Little, C. M., Mitrovica, J. X., Oppenheimer, M., Rasmussen, D. J., Strauss, B. H. & Tebaldi, C. (2014). Probabilistic 21st and 22nd Century Sea-Level Projections at a Global Network of Tide-Gauge Sites. Earth’s Future, 2(8), 383–406.
  • Kulp, S. A. & Strauss, B. H. (2019). New Elevation Data Triple Estimates of Global Vulnerability to Sea-Level Rise and Coastal Flooding. Nature Communications, 10(1), 4844. Retrieved June 21, 2020, from http://www.nature.com/articles/s41467-019-12808-z
  • Muis, S., Verlaan, M., Winsemius, H. C., Aerts, J. C. J. H. & Ward, P. J. (2016). A Global Reanalysis of Storm Surges and Extreme Sea Levels. Nature Communications, 7.

Subscribe to our newsletters

The best environmental stories of the week and month, handpicked by our Editor. Make sure you're on top of what's new in the climate.

SUBSCRIBE