


Torrential rain often causes flooding and landslides in Japan, leaving destruction, death and injury behind. Officials had the world’s largest water drainage facility built under Tokyo to counter it but sea level rise could render it futile.
Earth.Org takes a closer look.
—
How Will Rising Sea Levels Affect Tokyo, Japan?
The Tokyo Metropolis is home to nearly 14 million people, and the Greater Tokyo area to more than 37 million. It sits on a floodplain surrounded by five large rivers that regularly overflow. Moreover, rapid urban expansion combined with excessive groundwater extraction are causing the land to subside. These factors magnify floods from frequent typhoons and have forced city planners to create innovative and ambitious flood control systems, such as the Metropolitan Area Outer Underground Discharge Channel (commonly called G-cans).
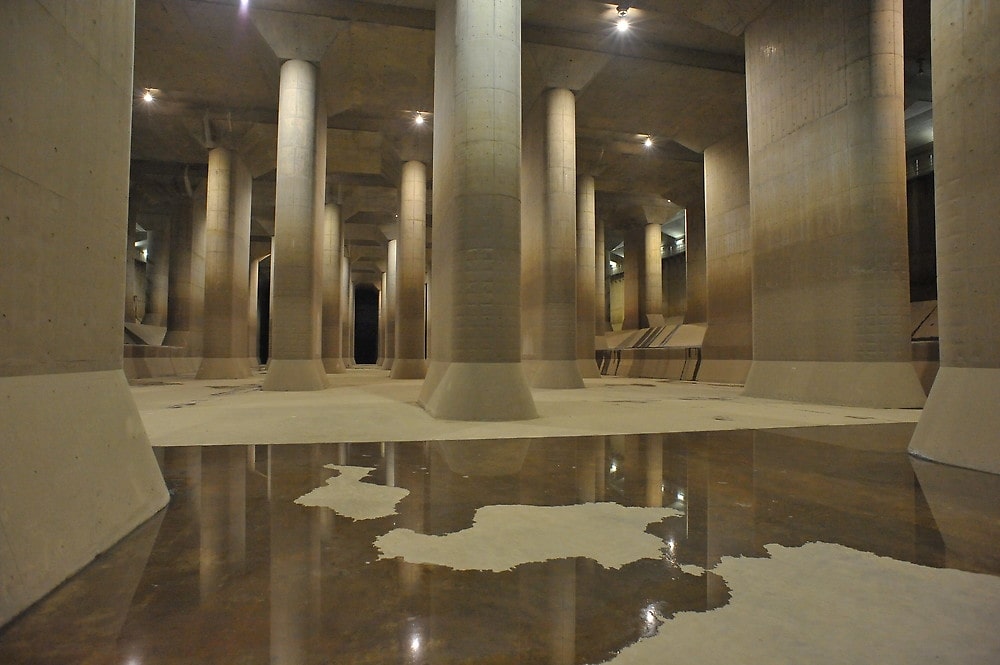
One of the 5 water silos of the Metropolitan Area Outer Underground Discharge Channel. Credit: Edogawa River Office
The complex was finished in 2006 after 14 years of construction, and cost around USD $2 billion. It consists of 5 huge silos under each of the five rivers Tokyo is built around, with a tunnel system allowing water to flow unidirectionally toward a giant pump at the endpoint. The structure measures 6.3km from end to end, and the pump can force 200 tons of water out into the Edo River per second.
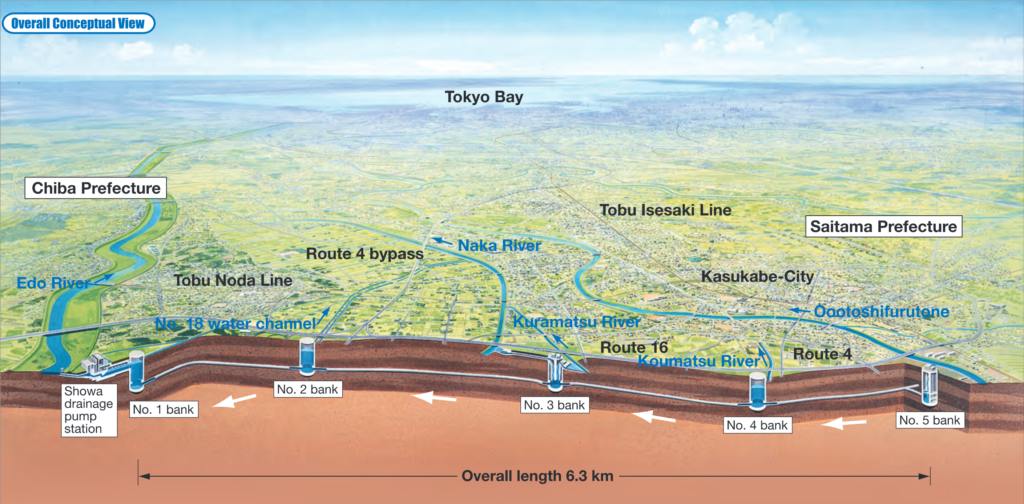
Map of the Metropolitan Area Outer Underground Discharge Channel. Credit: Edo River Office.
Despite the scale of the installation, its upper limits have already been tested. In 2015, a typhoon filled the G-cans enough for the pump to take 4 full days to empty them. This is not to say that the Discharge Channel is not performing well, but it may not be sufficient to protect Tokyo against heavier downpour and sea level rise that the latest assessments expect.
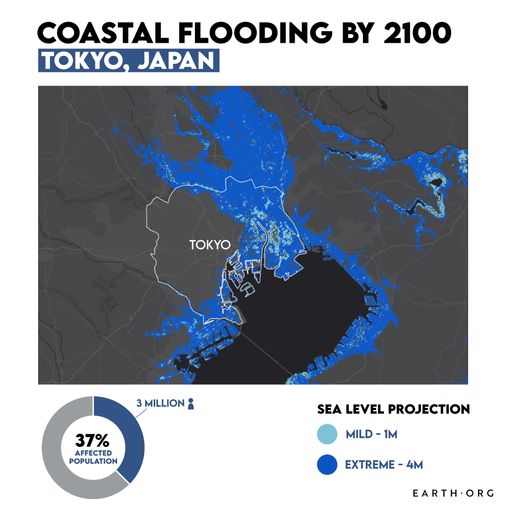
In fact, sea level rise is projected to hit Japan particularly hard. Local water rise of 2 metres would put nearly 200 km² under water. Even if this is somehow mitigated, the additional pressure of a strong typhoon would surely overwhelm anything but the best flood control system imaginable by man. Despite their accomplishments so far, the Japanese cannot rest easy yet. Earth.Org has modelled what flooding on top of extreme sea level rise could look like in Tokyo by 2100 to illustrate the predicament.
Methodology
Global mean sea level is projected to rise by 2m at the end of this century. However, in order to determine local sea level rise (SLR), one has to take into account local coastal flood levels which could be 2.8m above Mean Higher-High Water (MHHW) at extreme forecasts. These local levels bring variability to the projected SLR from 1m to 6.5m (eg. Rio vs Kolkata).
The SLR scenarios used in this study are based on the forecasts from Climate Central – Coastal Risk Screening Tool with the following parameters:
- Sea level Projection Source
- Coastal Flood Level
- Pollution Scenario
- Luck
Sea level Projection Source: is from two highly cited journals by Kopp et al., estimating SLR mainly due to ocean thermal expansion and ice melt. The mid-range scenario projected 0.5-1.2m of SLR based on different representative concentration pathways (RCP) defined by the IPCC. While the pessimistic scenario added more mechanisms of ice-sheet melting, estimating SLR at 1m-2.5m in 2100, with projection of 10m SLR at 2300.
Coastal Flooding: More frequent coastal flooding is a direct impact of sea-level rise. Based on the Global tides and surge reanalysis by Muis et al., (2016), it is estimated that the extreme coastal water level could be from 0.2 – 2.8m over mean level. While in extreme cases like China and the Netherlands it could experience 5-10m of extreme sea levels. Here, the coastal local flood level is added on top of the projected SLR.
Pollution Scenario: allows to choose the RCP, the greenhouse gas concentration trajectory defined by the IPCC. The mild level is based on RCP4.5, of 2°C temperature rise; while Extreme level is based on RCP 8.5, of 4°C temperature rise.
Luck: applies to the the baseline SLR, defined in the “Sea level projection” section, upon which we add flooding. “Mild” refers to the mid-range scenario of 0.5-1.2m, and “extreme” to the pessimistic scenario of 1-2.5m. We used the high-end value of each scenario (mild = 1m; extreme = 2.5m).
References:
-
Kulp, Scott A., and Benjamin H. Strauss. “New elevation data triple estimates of global vulnerability to sea-level rise and coastal flooding.” Nature communications 10.1 (2019): 1-12.
-
Florczyk, A. J., Corbane, C., Ehrlich, D., Freire, S., Kemper, T., Maffenini, L., Melchiorri, M., Politis, P., Schiavina, M., Sabo, F. & Zanchetta, L. (2019). GHSL Data Package 2019 Public Release.
-
Kopp, R. E., DeConto, R. M., Bader, D. A., Hay, C. C., Horton, R. M., Kulp, S., Oppenheimer, M., Pollard, D. & Strauss, B. H. (2017). Evolving Understanding of Antarctic Ice-Sheet Physics and Ambiguity in Probabilistic Sea-Level Projections. Earth’s Future, 5(12), 1217–1233.
-
Kopp, R. E., Horton, R. M., Little, C. M., Mitrovica, J. X., Oppenheimer, M., Rasmussen, D. J., Strauss, B. H. & Tebaldi, C. (2014). Probabilistic 21st and 22nd Century Sea-Level Projections at a Global Network of Tide-Gauge Sites. Earth’s Future, 2(8), 383–406.
-
Kulp, S. A. & Strauss, B. H. (2019). New Elevation Data Triple Estimates of Global Vulnerability to Sea-Level Rise and Coastal Flooding. Nature Communications, 10(1), 4844. Retrieved June 21, 2020, from http://www.nature.com/articles/s41467-019-12808-z
-
Muis, S., Verlaan, M., Winsemius, H. C., Aerts, J. C. J. H. & Ward, P. J. (2016). A Global Reanalysis of Storm Surges and Extreme Sea Levels. Nature Communications, 7.


![The Statistics of Biodiversity Loss [2020 WWF Report]](https://earth.org/wp-content/uploads/2020/12/lprwinkyTHB-544x306.jpg)

