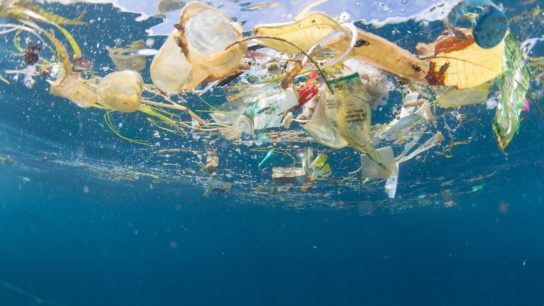
As the second most abundant greenhouse gas in our atmosphere (after water vapor), carbon dioxide (CO2) has become a direct proxy for measuring climate change. Its levels have varied widely over the course of the Earth’s 4.54 billion year history, partly driving swings in our planet’s average temperature.
—
The History of CO2
Scientific consensus today describes our atmosphere’s evolution in three stages.
Around the time of Earth’s formation, our solar system was dense with helium and hydrogen which bounced around the Earth’s surface at extremely high temperatures. These molecules eventually escaped into space and were replaced by our second atmosphere: volcanic emissions. Eruptions dispersed water steam, CO2, and ammonia (one nitrogen and three hydrogens), forming a gassy blanket above and early water bodies below. CO2 slowly dissolved into the shallow ocean and allowed cyanobacteria to perform oxygen-emitting photosynthesis. This oxygen eventually accumulated until the atmospheric composition changed enough to kill off most micro-organisms present at the time, about 2.4 billion years ago.
CO2 and Past Climates
As a point of reference, pre-industrial CO2 levels were around 280 parts per million (ppm). Today, we stand near 426.24 ppm.

The most distant period in time for which we have estimated CO2 levels is around the Ordovician period, 500 million years ago. At the time, atmospheric CO2 concentration ranged between 3,000 to 9,000 ppm. The average temperature wasn’t much more than 10C above today’s temperature, and those of you who have heard of the runaway hothouse Earth scenario may wonder why it didn’t happen then. Major factors were that the Sun was cooler, and the planet’s orbital cycles were different.

CO2 levels are determined by the imbalance between carbon sequestration (burial in sediments, capture by plants), and carbon emissions (decomposition and volcanic activity). Imbalances in this system created a downward trend in CO2 levels, leading to a glaciation period around 300 million years ago. This was followed by a period of intense volcanic activity, doubling CO2 concentration to about 1,000 ppm. Levels then dropped until they reached today’s concentrations during the Oligocene era, 33 to 23 million years ago, when temperatures were still 4-6C higher than today.
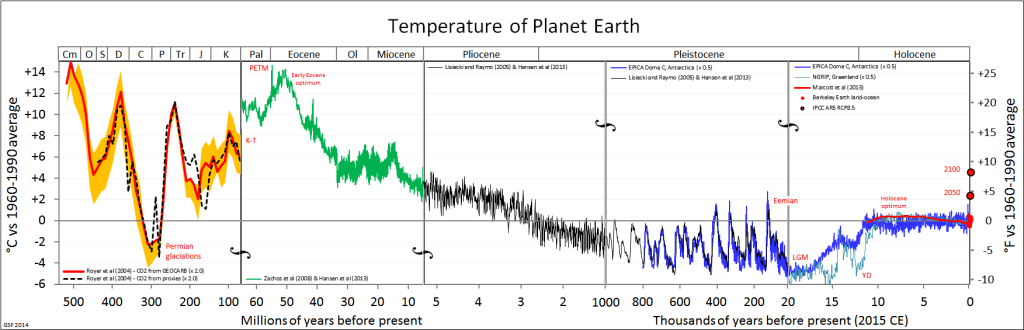
This is quite a worrying fact as the amounts of greenhouse gases we have emitted could already potentially take us back to similar conditions.
CO2 Data from Ice Cores
It is undeniable that the climate is an extremely complicated system with many factors that we still do not quite understand, so such statements need to be taken with a grain of salt. Moreover, the further we look back, the more uncertainty there is around the data. Robust evidence “only” spans back 800,000 years thanks to ice cores providing high-resolution records in the form of air bubbles trapped under the freezing snow.

The Highest Levels of Co2 in Recent History
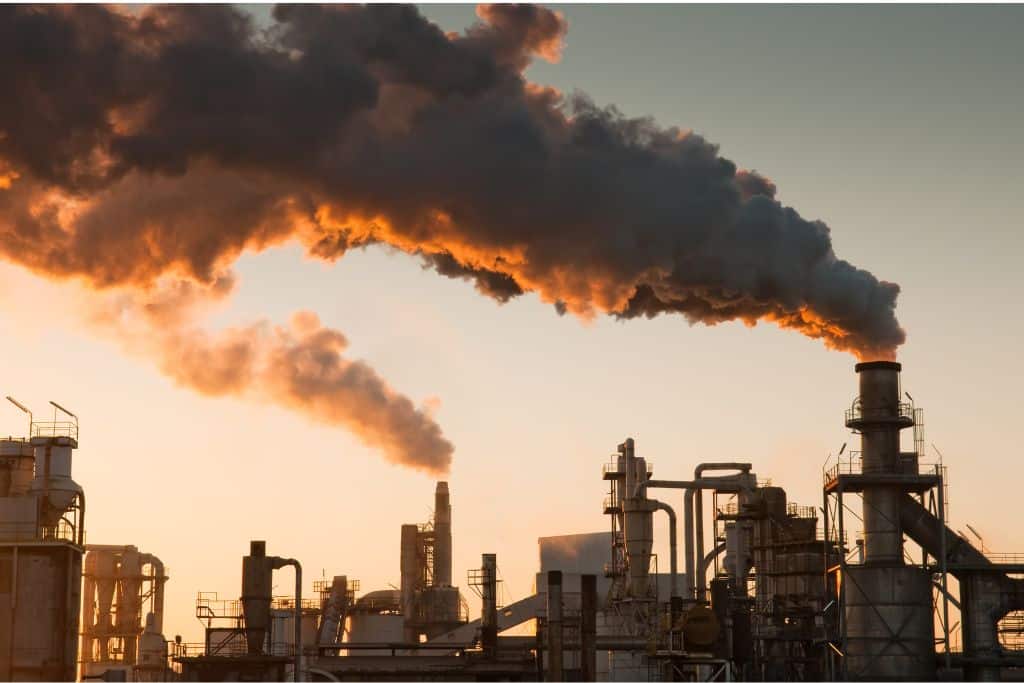
We use this record as a baseline to compare current events to, and the post-industrial upward trend in CO2 concentrations is evident. Unfortunately, the trend is recent enough that the results have yet to fully kick in. The time lag between CO2 emission and their pollution and warming effect is around 50 years, and whatever changes we observe now are only the tip of the iceberg.
Looking back at the 2 extra degrees of warmth last time CO2 levels were this high (Pliocene era, 3 million years ago), should be enough of a call to action considering the damage two more degrees would cause today.
This article was originally published on August 12, 2020 and updated on August 28, 2025.
References
Inglis, Gordon N., et al. “Descent toward the Icehouse: Eocene sea surface cooling inferred from GDGT distributions.” Paleoceanography 30.7 (2015): 1000-1020
By Glen Fergus – Own work; data sources are cited below, CC BY-SA 3.0, https://commons.wikimedia.org/w/index.php?curid=1240577
This story is funded by readers like you
Our non-profit newsroom provides climate coverage free of charge and advertising. Your one-off or monthly donations play a crucial role in supporting our operations, expanding our reach, and maintaining our editorial independence.
About EO | Mission Statement | Impact & Reach | Write for us

![The Statistics of Biodiversity Loss [2020 WWF Report]](https://earth.org/wp-content/uploads/2020/12/lprwinkyTHB-544x306.jpg)