


We often hear about future increases in global mean surface temperature (GMST), but the climate is a complex system, and there is a lot of variability depending on one’s location. A recent study by Suarez-Gutierrez et al. (2020)*, modelled the temperature extremes that could occur around the globe in different global warming scenarios. In this article, we look at how climate change could affect agriculture and global food security if we continue down the current path.
—
*Suarez-Gutierrez et al. (2020). Simulations were performed using the Max Planck Institute Grand Ensemble model.
Mapping by Keir Murdo.

Maximum absolute summer temperatures under a 4°C rise in GMST. The simulated maximum temperatures represent the 99.5th percentile value (0.5% most extreme) at each grid cell.
Small rises in average temperatures can have a great effect on weather extremes, and 4°C entails a larger swing than the Earth has experienced in the last 12,000 years. The extraordinary temperatures brought about about by climate change could seriously threaten food security and other livelihoods.
Crops can withstand and even find their yields enhanced at high temperatures, but most suffer greatly above the 29 to 32°C range. Some species in tropical areas display higher tolerance to heat, but around 38°C, all chlorophyllic plants suffer from photosynthetic inhibition. Above 45°C, lethal protein denaturation occurs.
In this first part of the series, we will be looking at the consequences of heat spikes in the breadbaskets of South America, India and the US.
South America
Argentina and Brazil produce 75% of South America’s maize and wheat production.
As the two primary agricultural producers of South America, Brazil and Argentina account for 16% of total global food and agriculture exports. In 2018, Latin American crop exports were valued at USD$110 billion.
Let’s put the focus on Argentina.

Yellow areas display where crops of any type are grown. Under a 4°C rise in GMST, orange areas show all cropland that could experience heat spikes in excess of 38°C, covering 85.6% of total cropland. Brown areas show cropland exposed to peak temperatures in excess of 45°C, covering 76.5% of total cropland.
Argentina produces approximately 20 million tons of wheat and 50 million tons of maize per year. The orange areas (38°C) equate to 92.7% of wheat production and 96.5% of maize production by weight. The brown areas (45°C) equate to 92.5% of wheat production and 95.5% of maize production.
The widespread crop failure expected under projected conditions would have grave consequences both locally and around the globe.
NB: It is unlikely for a heatwave to affect the entire region simultaneously. Rather, this is the entire zone at risk of experiencing a such extreme temperatures.
India
Let’s look at one of the most productive agricultural regions of the Indian subcontinent.

The region of Uttar Pradesh, in Northern India.
The region of Uttar Pradesh is heavily reliant on agriculture, providing employment to 65% of its 205 million inhabitants. It is the largest grain (18% of total) and milk (17% of total) producing region of India.

Crop maps of India, with Uttar Pradesh in pink contour. Top left: wheat crops, top right: rice crops, bottom left: maize crops, bottom right: sugarcane crops.
Uttar Pradesh is by far India’s largest wheat producing state, with almost a third of total national tonnage grown there. It is second only to West Bengal in rice production, produces half of all Indian sugarcane, and ranks 6th for maize tonnage.
The region is projected to experience temperature extremes with 4°C of global warming. The staple crops of wheat, rice and maize will not be able to withstand heat spikes above the 45°C threshold, leading to quasi-certain crop death.

Maximum absolute summer temperatures under a 4°C rise in GMST in Uttar Pradesh.
Crop losses can be weathered, and groundwater can be pumped up to make up for drought. However, preventive measures, both financial and resource-based, are difficult to implement against unexpected heat spikes.
USA
How will the United States fair in these conditions?
The US Midwest is home to the so-called “corn belt”, where most of the US corn and soybean production comes from.
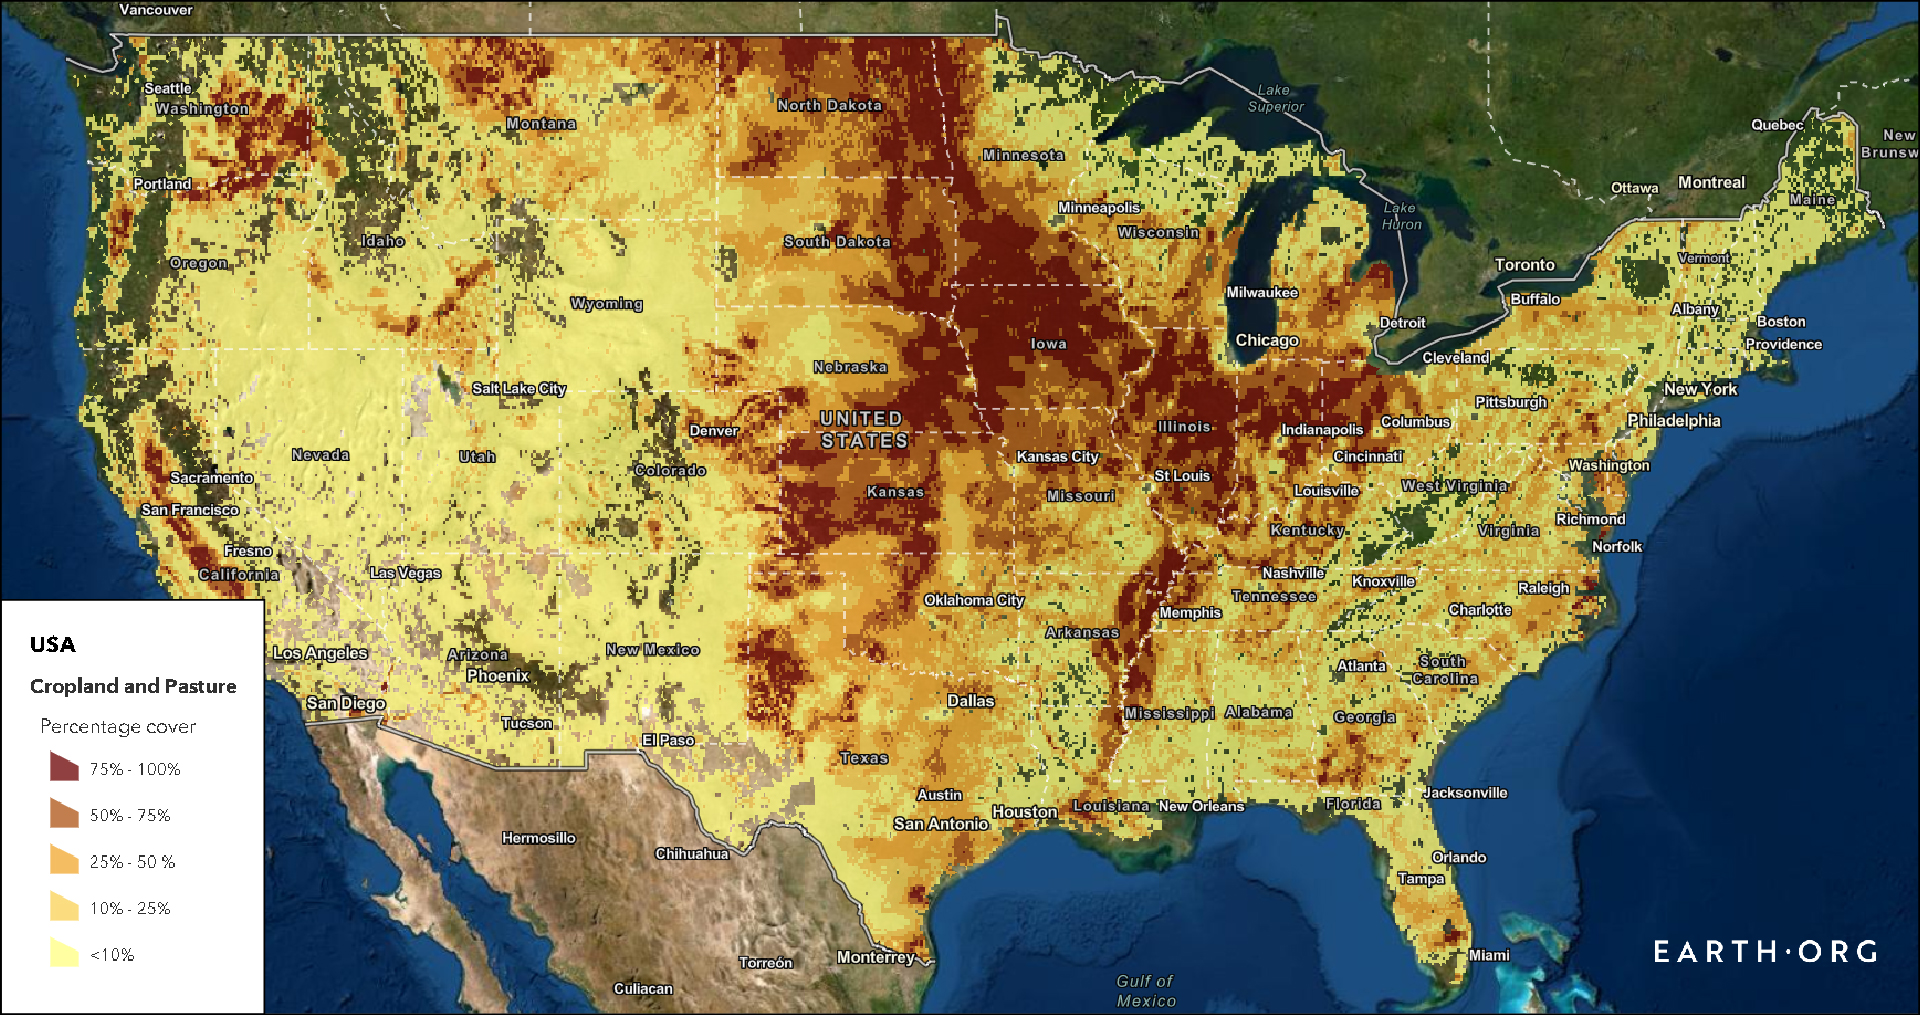
U.S. corn and soybean crop cover map.
The map below show us the crop cover minus all agricultural areas that could be affected by temperatures of 38°C and above under a 4°C rise in GMST.

The US has been experiencing a megadrought for the past 20 years, and the average annual losses are estimated in the range of $10 to $14 billion USD. These droughts generally do not hamper production in the corn belt, but the heat spikes modelled here threaten the area with widespread crop failure.
Additionally, high variability in temperature extremes is predicted over the entire corn belt. Despite the means and infrastructure for mitigation in the US, this will make it difficult to implement in a timely manner.
The model showcased here gives us a glimpse into the more extreme, but entirely possible consequences that could arise from 4°C of global warming. If left unchecked climate change could bring about conditions that could jeopardise our food security, whether or not we expect them.
Acknowledgements
This article was written by Owen Mulhern, and the maps were produced by Keir Murdo based on Suarez-Gutierrez et al. (2020). A special thanks goes out to Laura Suarez-Gutierrez for providing the data, and Rafaela Flach, who provided valuable information on the biology of plants and high temperatures. Simulations were performed using the Max Planck Institute Grand Ensemble model.
You might also like: The Future of Canada’s Oil Sands
References
- Suarez-Gutierrez et al. (2020).
- Nievola, C. C., et al. (2017)
- OECD – FAO Agricultural Outlook
- Ramankutty et al (2010)
- Knoema – Climate Change and Food Security.
- Monfreda et al (2008)
- Agriculture Department, Uttar Pradesh
- Directorate of Economics & Statistics, Government of India
-
Ministry of Agriculture and Farmers Welfare, Government of India


![The Statistics of Biodiversity Loss [2020 WWF Report]](https://earth.org/wp-content/uploads/2020/12/lprwinkyTHB-544x306.jpg)


