


One of the more direct effects of climate change, besides global warming and altered weather patterns, is sea level rise. Just like warming patterns, sea level rise does not appear to be uniform throughout the globe, with some areas registering a rate of around 10 mm annually since 1993, while other regions register an annual 3 mm rise in sea levels. Overall, we’ve experienced 21-24 centimetres of sea level rise in the past 140 years, but how do we measure this?
—
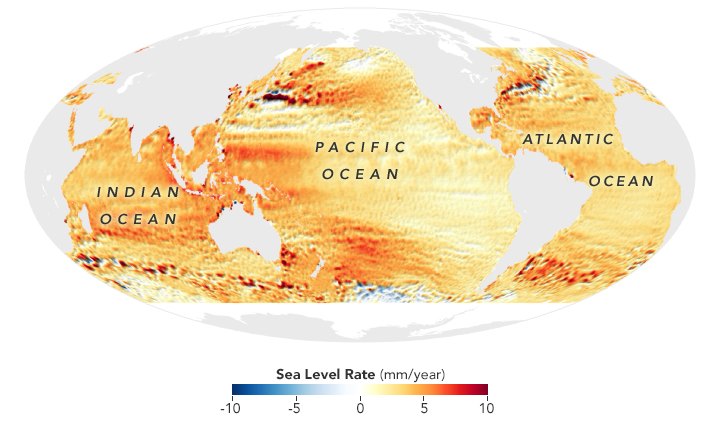
Satellite altimetry measurements of sea level changes over 1993 to 2018, from data collected by the TOPEX-Poseidon and three Jason altimetry missions (Source: NASA Earth Observatory).
Traditional methods for measuring sea level come in the form of tidal gauges, usually installed in coastal areas and harbours.
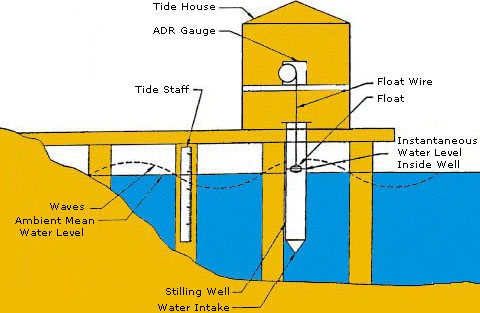
Traditional tide gauge mechanism schematic. Source: NOAA.
This method over-represents places like Europe and Japan, while having big data gaps for non-coastal areas (i.e. the Pacific). Combined with the uneven distribution of landmasses and islands where tidal gauges could be installed, this method has many inconsistencies.

Satellite orbits are able to cover more significant areas of ocean surface, with reasonably uniform representation, in contrast to traditional tidal gauge measurements (Source: NASA Earth Observatory).
Technological advancement has brought along the use of altimetry satellites to measure the ocean surface. Since their inception in 1992, four missions have been conducted to record standardised measurements of the sea level and its changes, using a satellite which completes the same orbit every 10 days.
Altimetry satellites work by using radar altimeters to emit pulses of radio waves onto the ocean surface, and calculating the time needed for these waves to reflect back to the satellite from the ocean surface. Additional calculations are made to account for factors affecting these readings, and these allow research groups to derive the sea level height of a given area of ocean.
While giving areas of ocean surface almost equal statistical representation in satellite altimetry, there have been some technical challenges over the years. For instance, air moisture can slow down radio signals reflecting off the ocean surface, causing some over- or underestimations in sea level. Once aware of this problem, scientists began measuring the water content of the atmosphere under the satellite and mathematically correcting the signal.
We must remember that climate science is still evolving, having made leaps and bounds since 1985 thanks to satellite technology. Researchers now have access to more data than ever before, but our global climate is an intricate system, and we are learning more about it every day. It is crucial for our decision makers to stay up to date with the latest developments and updates, and for policies to reflect our best understanding of the present and the future.
This article was written by Javier Chai Rui Cheng.


![The Statistics of Biodiversity Loss [2020 WWF Report]](https://earth.org/wp-content/uploads/2020/12/lprwinkyTHB-544x306.jpg)


