


As climate change supercharges fire weather across Southern California, predicting where and when the next wildfire will strike has become a matter of survival. Earth.Org trains machine learning models on historical weather patterns in an attempt to turn complex atmospheric variables into a powerful early-warning system capable of forecasting blazes before the first spark is struck.
—
When examining climate-driven natural disasters in the United States, wildfires are frequently at the forefront of the conversation. As wildfires have become more prevalent, they have resulted in higher damages and impacts to society; in 2025, for instance, the Los Angeles wildfires swept through 40,000 acres of land in the area and racked up over $200 billion in estimated damage and economic loss.
But Los Angeles is just one of many examples of areas that are seeing a spike in climate change-fueled wildfires. According to Climate Central, the number of ‘fire weather’ days in San Diego, California, is on the rise; in nearby southeastern desert basins, including Palm Springs, it has increased by as much as 60 days between 1973 and 2024.
There are multiple variables that drive wildfire prevalence in these areas, but some of the most common ones include weather factors like humidity, temperature, and wind speed. For this analysis, we look at past data in San Diego to see if these specific variables can be predictors for the occurrences of wildfires in the area.
The Data: Wildfire Weather Variables vs. Wildfire Occurrences
Historical wildfire data from the state of California (Cal Fire) as well as weather data from the National Oceanic and Atmospheric Administration (NOAA) between 2019 and 2025 were pulled to track wildfire occurrences and weather readings for San Diego during that time span.
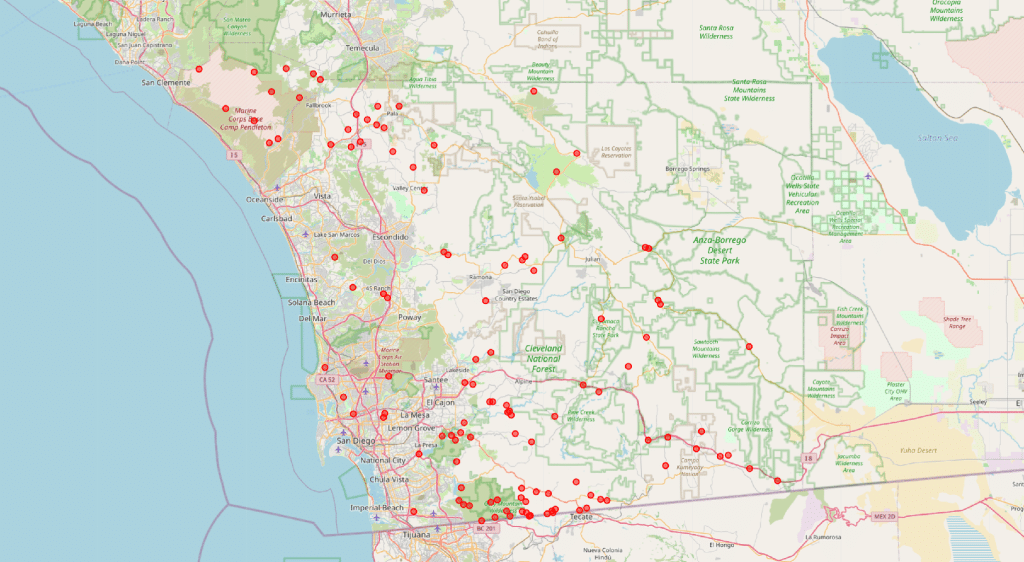
Daily weather readings for average humidity, average wind speed, maximum and minimum dry bulb temperatures, and peak wind speed were all combined to be used as multiple independent variables to predict whether a wildfire occurs for a specific day or not (yes or no) as the dependent binary outcome variable against all those readings. A map of wildfire occurrences recorded in San Diego between 2019 and 2025 is displayed below.
To predict wildfire occurrences for this data, three binary machine learning models were constructed and compared against each other to identify the model most suitable for predicting them.
To evaluate our models fairly, we split our data into two groups: 70% was used as a “training set” to teach the models the historical relationships between weather patterns and fires, while the remaining 30% was held back as a “testing set.” This test set acts as an exam, grading how accurately the models predict fires on data they haven’t seen before.
Logistic Regression Model Results
The first of three models built was a logistic regression model – a machine learning algorithm used for binary classification problems to predict the probability of a binary outcome; in this case, predicting the probability of whether wildfires will occur or not.
After the model was built, key parameters were found to decipher the results. The first was the accuracy score, which is used to assess the ratio of classification outcomes that were correct. The next parameter was the precision score, which is similar to the accuracy score, but focuses on the correctness of “clear” day predictions (number of days that did not have wildfires that were correctly predicted versus days that were predicted to not have wildfires but they actually happened). The results of the logistic regression model are displayed below.
| Logistic Regression Parameters | Value |
| Accuracy Score | 95.96% |
| Precision Score | 95.96% |
The last parameter found was the confusion matrix, which displays where the model was right and wrong with predicted versus actual outcomes.

To visualize where our models succeeded and struggled, a confusion matrix was used. Rather than getting bogged down in data science jargon, think of this matrix as a simple scoreboard. It maps out four distinct outcomes: how often the model correctly predicted “clear” days (top left value), how often it successfully flagged an active wildfire (bottom right value), and the critical errors – the false alarms (predicting a fire that didn’t happen; top right value) and the missed warnings (failing to predict an active fire; bottom left value).
Naive Bayes Model Results
The second of the three models built was a Naive Bayes classifier, which is another machine learning model that is used for binary classification problems (predicting two different outcomes). This model differs from logistic regression since it is used not only for calculating the probability of an event in the future, but it also assumes that the features (predictor variables) that are fed into the model are all independent of each other; in other words, the presence of one feature does not affect the other ones and they have no relationship to each other (hence why it is called a naive classifier). After this model was built, the same key parameters as the logistic regression model were found, with the results displayed below.
| Naïve Bayes Classifier Parameters | Value |
| Accuracy Score | 95.80% |
| Precision Score | 95.95% |

Random Forest Model Results
The last of three models built was a random forest, which is also utilized for binary classification problems but differs from the first two as it consists of a large number of decision trees, or links, that represent decisions. Each “leaf” represents an outcome (wildfire occurrence or not) that all work together collectively as an ensemble as each tree gives a classification prediction and whichever outcome tallies the most results in the ensemble will provide the prediction for the model. After this model was built, the accuracy and prediction scores were found again, with the results displayed below.
| Random Forest Parameters | Value |
| Accuracy Score | 96.12% |
| Precision Score | 96.42% |
Final Thoughts
Going back to the original question of whether or not we can use potential wildfire forecasting variables to predict wildfire occurrences in San Diego, the results show that it can be done, with similar results for all three models demonstrating very high accuracy and precision scores. However, the random forest model displayed slightly higher values for accuracy (96.12% versus 95.96% and 95.80%) and precision (96.42% versus 95.96% and 95.95%) compared to the other two models.
What’s more, looking at its confusion matrix, the random forest model had a slightly stronger set of predictions since, even though the random forest model predicted two false alarms for wildfire occurrences and the Naive Bayes classifier had one, the random forest model was able to detect the most actual wildfire occurrences in the data (three of them) while the other two models predicted zero. Even though we could see that most days do not have a wildfire occurrence in the data, there were still occurrences in about 4% of the total days of data. So, as the random forest model was able to correctly predict a few instances of those actually happening, that model would be preferable to utilize for this scenario.
Even though the results for the analysis were strong, there are additional ways in which it can be expanded upon, such as investigating different regions in California with the same Cal Fire data or different states in the United States with different statewide data sources. Another way it could be expanded upon is by running additional machine learning algorithms suited for binary classification, such as a regular decision tree, a neural network, or a support vector machine (SVM), to use as additional comparison points to the three models constructed for this analysis.
As wildfires continue to increase in frequency in many regions due to climate change, looking into different methods to predict their occurrences provides important insights into proper associated preparations as well as driving sustainability initiatives.
Featured image: slworking2 via Flickr.
This story is funded by readers like you
Our non-profit newsroom provides climate coverage free of charge and advertising. Your one-off or monthly donations play a crucial role in supporting our operations, expanding our reach, and maintaining our editorial independence.
About EO | Mission Statement | Impact & Reach | Write for us


![The Statistics of Biodiversity Loss [2020 WWF Report]](https://earth.org/wp-content/uploads/2020/12/lprwinkyTHB-544x306.jpg)