

Miami is notoriously vulnerable to sea level rise, and its mayor has been vocal about the looming dangers of climate change in a relatively skeptical political environment. Mitigation plans involve massive engineering feats that may help in the short-term, but will eventually be overrun.
Earth.Org takes a closer look.
—
A major centre of finance, commerce, culture, arts and trade, Miami is a global city with a USD $345 billion GDP. Built on a broad, low-lying plain between Everglades wetlands and Biscayne Bay, its citizens are already experiencing early signs of climate change.
Why?
Since 1870, global sea levels have risen by an average of 20 cm, but Southeast Florida’s local levels have risen by 30 cm. By 2060, it could double or triple that.
The impacts of sea level rise in Miami
- Prolonged flooding after storms calls for a renovation of the city’s drainage system, which would cost USD $206 million.
- Beaches are eroding and domestic sand resources are dwindling. The Army Corps of Engineers estimated that the equivalent of 10,781 football fields covered in 30 cm of sand would be necessary to sustain Miami’s beaches for the next 50 years.
- Hurricane-driven storm surges (of which there were 8 between 2004 and 2005 alone) will chrome 3 times as likely at 30 cm sea level rise, and 15 times more at 60 cm.
- Porous limestone ground makes seawalls incapable of stopping salt water from infiltrating aquifers, negatively impacting agriculture and drinking water reserves.
- Water rise of only 10 to 35 cm would be sufficient to reduce 70% of Miami’s coastal flood control drainage capacity.
In light of the last point, officials have decided to build a network of huge pumps that force water out of flood-prone areas and into Biscayne Bay. There are over 30 pumps today, with 90 planned in total. The estimated cost for 3 pumps, including land acquisition, is USD $ 200 million. Unfortunately, even all 90 cannot protect the larger Miami area.
The city of Miami still toils away to mitigate flooding, raising roads and buildings, hoping to buy time. The world would do well to keep an eye on how Miami fares, as it may be the first major victim of climate change.
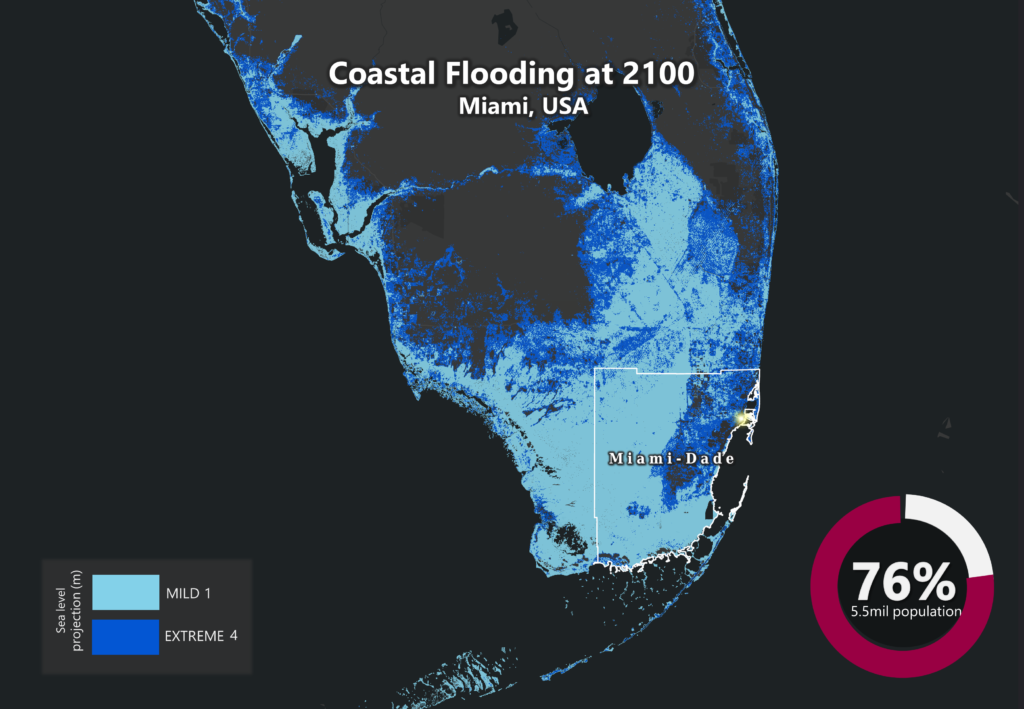
Earth.Org has mapped severe flooding in southern Florida by the end of the century to illustrate the impending danger.
Sea Level Rise: Miami’s Map
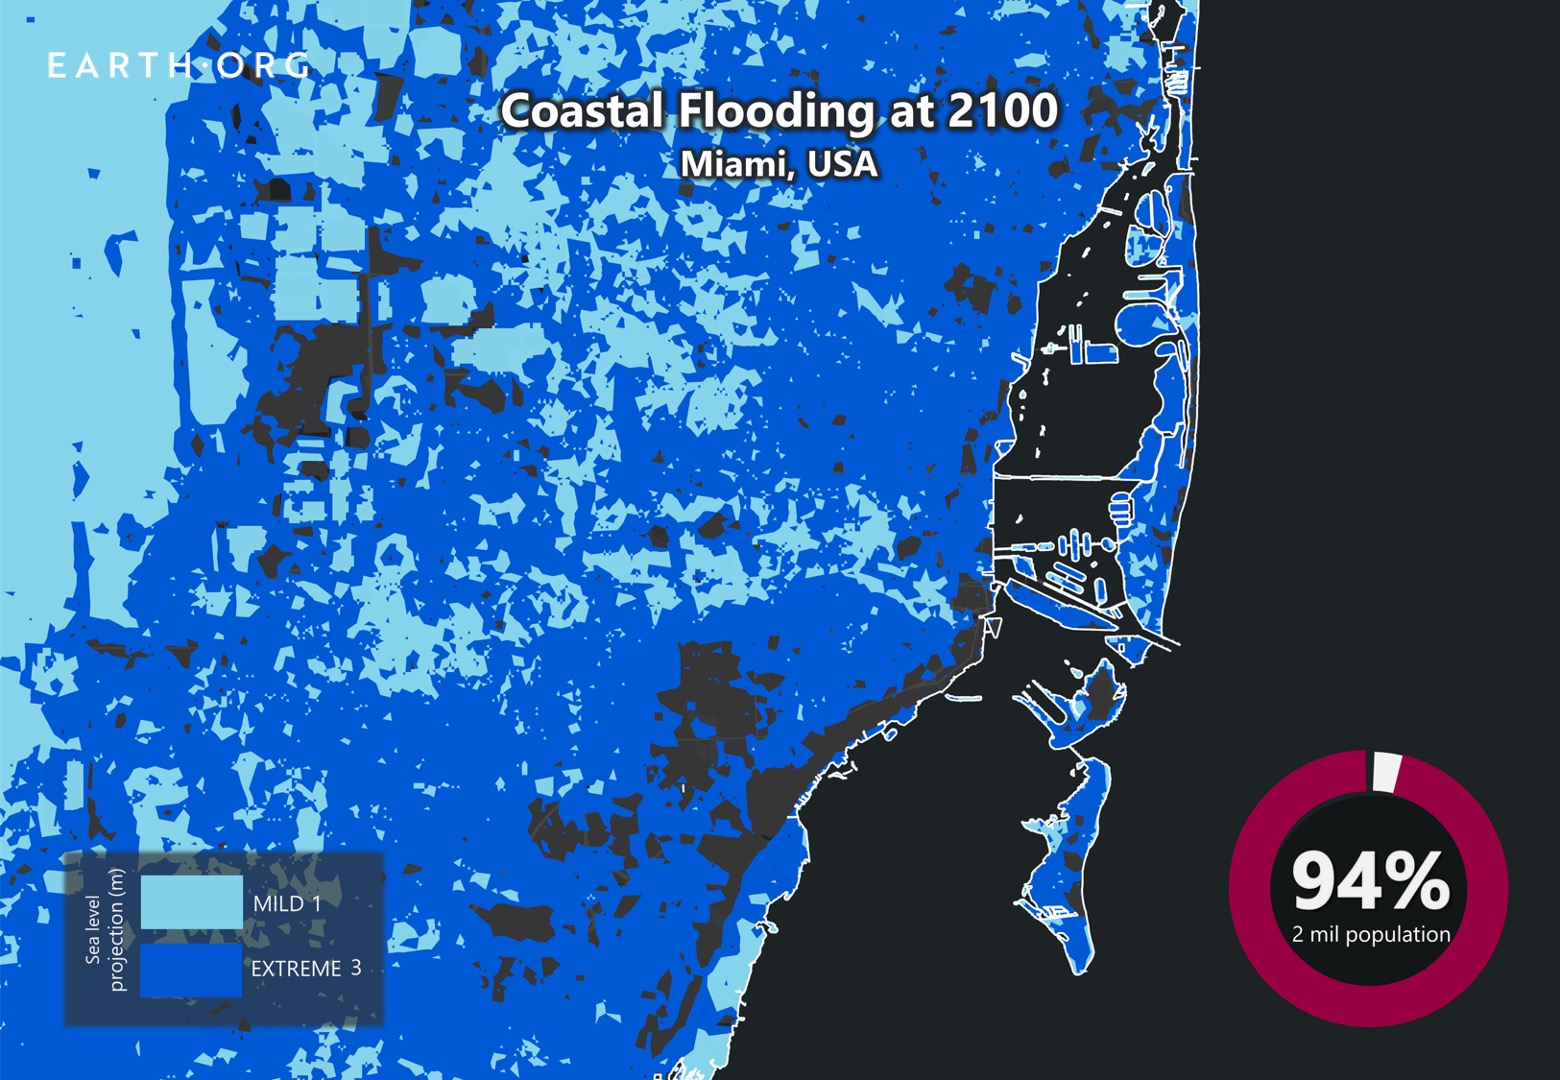
Sea level rise projections by 2100 for two scenarios with the amount of rise in meters indicated (mild = 1m; extreme = 4m). Percentage and total population displacement indicated bottom right, yellow star on the city of Miami.
Methodology
Global mean sea level is projected to rise by 2m at the end of this century. However, in order to determine local sea level rise (SLR), one has to take into account local coastal flood levels which could be 2.8m above Mean Higher-High Water (MHHW) at extreme forecasts. These local levels bring variability to the projected SLR from 1m to 6.5m (eg. Rio vs Kolkata).
The SLR scenarios used in this study are based on the forecasts from Climate Central – Coastal Risk Screening Tool with the following parameters:
- Sea level Projection Source
- Coastal Flood Level
- Pollution Scenario
- Luck
Sea level Projection Source:
From two highly cited journals by Kopp et al., estimating SLR mainly due to ocean thermal expansion and ice melt. The mid-range scenario projected 0.5-1.2m of SLR based on different representative concentration pathways (RCP) defined by the IPCC. While the pessimistic scenario added more mechanisms of ice-sheet melting, estimating SLR at 1m-2.5m in 2100, with a projection of 10m SLR at 2300.
Coastal Flooding
More frequent coastal flooding is a direct impact of sea-level rise. Based on the Global tides and surge reanalysis by Muis et al., (2016), it is estimated that the extreme coastal water level could be from 0.2 – 2.8m over the mean level. While in extreme cases like China and the Netherlands it could experience 5-10m of extreme sea levels. Here, the coastal local flood level is added on top of the projected SLR.
Pollution Scenario:
Allows choosing the RCP, the greenhouse gas concentration trajectory defined by the IPCC. The mild level is based on RCP4.5, of 2°C temperature rise; while the Extreme level is based on RCP 8.5, of 4°C temperature rise.
Luck:
Applies to the baseline SLR, defined in the “Sea level projection” section, upon which we add flooding. “Mild” refers to the mid-range scenario of 0.5-1.2m, and “extreme” to the pessimistic scenario of 1-2.5m. We used the high-end value of each scenario (mild = 1m; extreme = 2.5m).
You might also like: Sea Level Rise by 2100 – New York City
References:
-
Kulp, Scott A., and Benjamin H. Strauss. “New elevation data triple estimates of global vulnerability to sea-level rise and coastal flooding.” Nature communications 10.1 (2019): 1-12.
-
Florczyk, A. J., Corbane, C., Ehrlich, D., Freire, S., Kemper, T., Maffenini, L., Melchiorri, M., Politis, P., Schiavina, M., Sabo, F. & Zanchetta, L. (2019). GHSL Data Package 2019 Public Release.
-
Kopp, R. E., DeConto, R. M., Bader, D. A., Hay, C. C., Horton, R. M., Kulp, S., Oppenheimer, M., Pollard, D. & Strauss, B. H. (2017). Evolving Understanding of Antarctic Ice-Sheet Physics and Ambiguity in Probabilistic Sea-Level Projections. Earth’s Future, 5(12), 1217–1233.
-
Kopp, R. E., Horton, R. M., Little, C. M., Mitrovica, J. X., Oppenheimer, M., Rasmussen, D. J., Strauss, B. H. & Tebaldi, C. (2014). Probabilistic 21st and 22nd Century Sea-Level Projections at a Global Network of Tide-Gauge Sites. Earth’s Future, 2(8), 383–406.
-
Kulp, S. A. & Strauss, B. H. (2019). New Elevation Data Triple Estimates of Global Vulnerability to Sea-Level Rise and Coastal Flooding. Nature Communications, 10(1), 4844. Retrieved June 21, 2020, from http://www.nature.com/articles/s41467-019-12808-z
-
Muis, S., Verlaan, M., Winsemius, H. C., Aerts, J. C. J. H. & Ward, P. J. (2016). A Global Reanalysis of Storm Surges and Extreme Sea Levels. Nature Communications, 7.


![The Statistics of Biodiversity Loss [2020 WWF Report]](https://earth.org/wp-content/uploads/2020/12/lprwinkyTHB-544x306.jpg)


