

Built on the Chao Phraya River delta in Thailand’s central plain, Bangkok is a low-lying city with an average elevation of 1.5 metres above sea level. Sea level rise alone, expected to reach 1 to 2 metres, will submerge most of the city by the end of the century. Disruptive floods will become catastrophic events, putting lives and infrastructure in danger, and costing a great deal to adapt to.
Earth.Org has mapped severe flooding in Bangkok by 2100 to illustrate the impending danger.
—
Bangkok lies on what used to be an extensive swampland. The water-logged area was drained to accommodate for agriculture, and then urban expansion. It sits a layer of soft clay known as “Bangkok clay”, around 15 metres thick and housing beneath it a large groundwater reservoir. Like many other Asian cities, excessive extraction is causing alarming subsidence, whose rates reached 120 millimetres per year in 1981 (4.7 inches). This has been slowed thanks to more mindful practices, but parts of the city are now 1 metre below sea level.
Torrential rains readily fill up these lower areas, and poor drainage systems do little to mitigate severe flooding events that can persist for up to two months. Despite some effort to improve infrastructure, not enough is being done. A study by the OECD estimated that 5 out of the 10 million people living in Bangkok would be exposed to flood risk by 2070. Since then, the sixth IPCC Assessment Report is coming through with even more alarming projections for the end of the century.
If Thailand’s government is to avoid dire consequences, they must act now. A sense of urgency has settled on the population and officials alike, but a concrete plan has yet to be put forward. Earth.Org has modelled severe flooding on top of sea level rise by 2100 to illustrate the need for action.
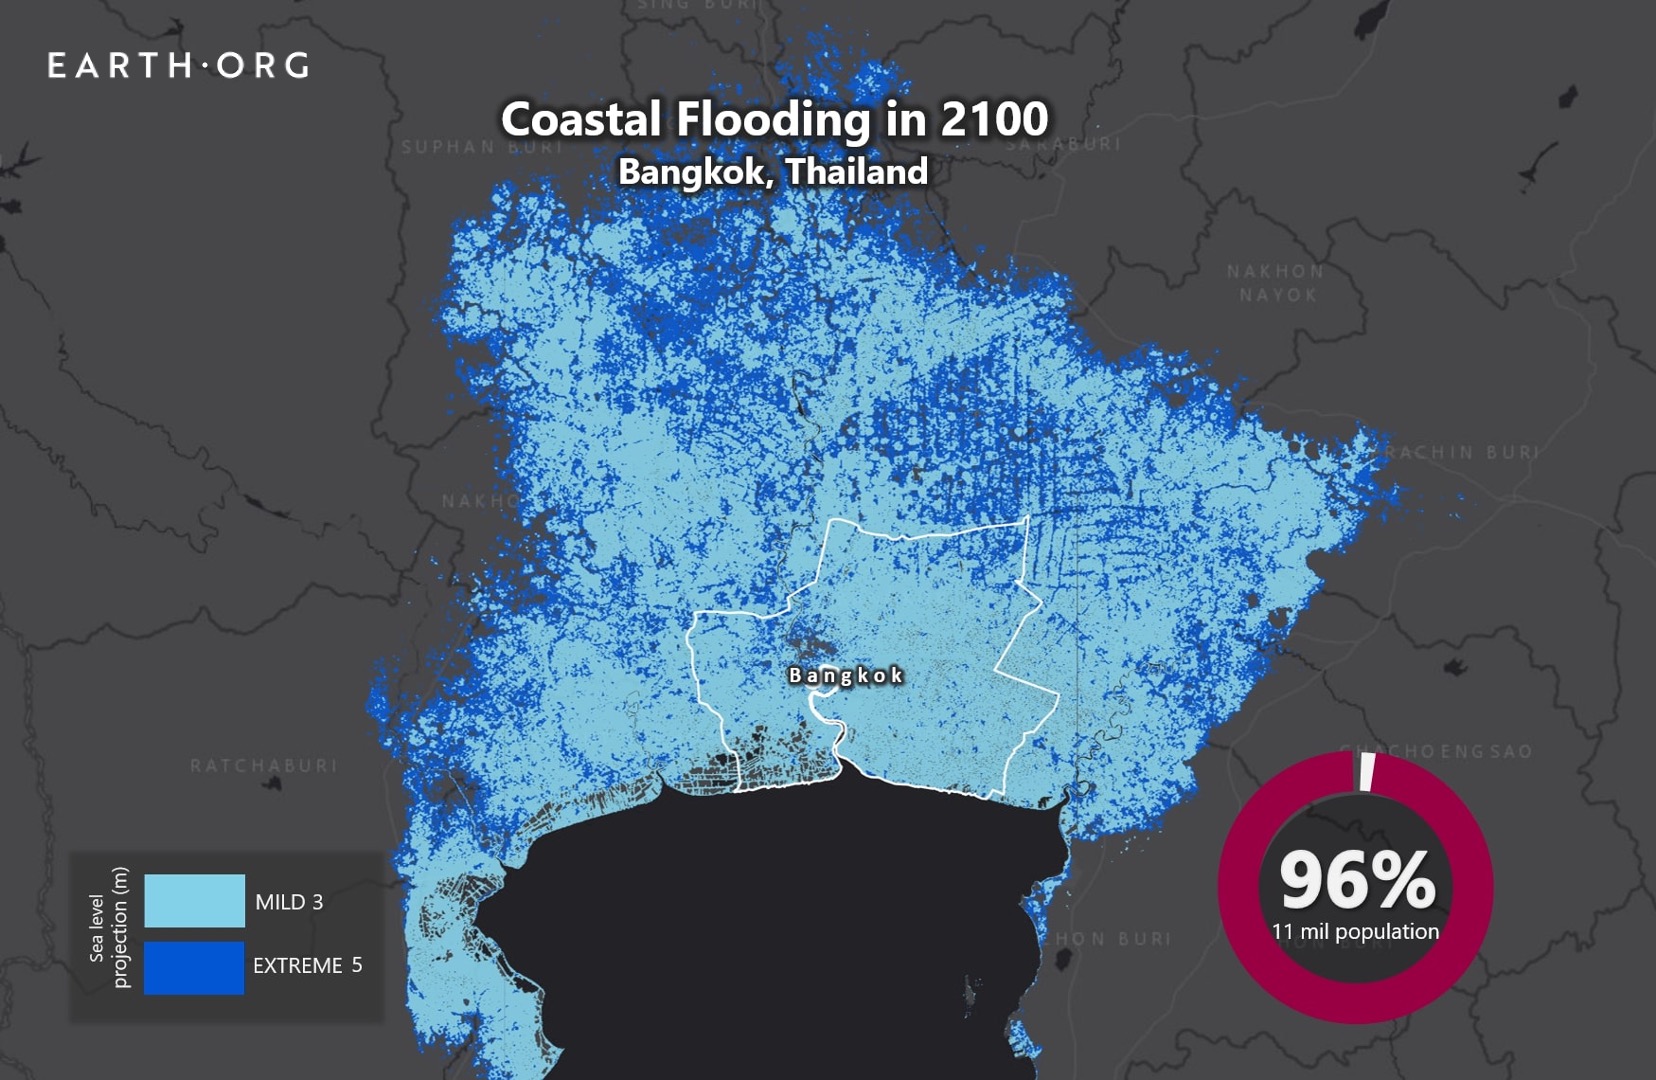
Sea level rise projections by 2100 for two scenarios with the amount of rise in meters indicated (mild = 3m; extreme = 5m). Percentage and total population displacement indicated bottom right.
Methodology
Global mean sea level is projected to rise by 2m at the end of this century. However, in order to determine local sea level rise (SLR), one has to take into account local coastal flood levels which could be 2.8m above Mean Higher-High Water (MHHW) at extreme forecasts. These local levels bring variability to the projected SLR from 1m to 6.5m (eg. Rio vs Kolkata).
The SLR scenarios used in this study are based on the forecasts from Climate Central – Coastal Risk Screening Tool with the following parameters:
- Sea level Projection Source
- Coastal Flood Level
- Pollution Scenario
- Luck
Sea level Projection Source: is from two highly cited journals by Kopp et al., estimating SLR mainly due to ocean thermal expansion and ice melt. The mid-range scenario projected 0.5-1.2m of SLR based on different representative concentration pathways (RCP) defined by the IPCC. While the pessimistic scenario added more mechanisms of ice-sheet melting, estimating SLR at 1m-2.5m in 2100, with projection of 10m SLR at 2300.
Coastal Flooding: More frequent coastal flooding is a direct impact of sea-level rise. Based on the Global tides and surge reanalysis by Muis et al., (2016), it is estimated that the extreme coastal water level could be from 0.2 – 2.8m over mean level. While in extreme cases like China and the Netherlands it could experience 5-10m of extreme sea levels. Here, the coastal local flood level is added on top of the projected SLR.
Pollution Scenario: allows to choose the RCP, the greenhouse gas concentration trajectory defined by the IPCC. The mild level is based on RCP4.5, of 2°C temperature rise; while Extreme level is based on RCP 8.5, of 4°C temperature rise.
Luck: applies to the the baseline SLR, defined in the “Sea level projection” section, upon which we add flooding. “Mild” refers to the mid-range scenario of 0.5-1.2m, and “extreme” to the pessimistic scenario of 1-2.5m. We used the high-end value of each scenario (mild = 1m; extreme = 2.5m).
References:
-
Kulp, Scott A., and Benjamin H. Strauss. “New elevation data triple estimates of global vulnerability to sea-level rise and coastal flooding.” Nature communications 10.1 (2019): 1-12.
-
Florczyk, A. J., Corbane, C., Ehrlich, D., Freire, S., Kemper, T., Maffenini, L., Melchiorri, M., Politis, P., Schiavina, M., Sabo, F. & Zanchetta, L. (2019). GHSL Data Package 2019 Public Release.
-
Kopp, R. E., DeConto, R. M., Bader, D. A., Hay, C. C., Horton, R. M., Kulp, S., Oppenheimer, M., Pollard, D. & Strauss, B. H. (2017). Evolving Understanding of Antarctic Ice-Sheet Physics and Ambiguity in Probabilistic Sea-Level Projections. Earth’s Future, 5(12), 1217–1233.
-
Kopp, R. E., Horton, R. M., Little, C. M., Mitrovica, J. X., Oppenheimer, M., Rasmussen, D. J., Strauss, B. H. & Tebaldi, C. (2014). Probabilistic 21st and 22nd Century Sea-Level Projections at a Global Network of Tide-Gauge Sites. Earth’s Future, 2(8), 383–406.
-
Kulp, S. A. & Strauss, B. H. (2019). New Elevation Data Triple Estimates of Global Vulnerability to Sea-Level Rise and Coastal Flooding. Nature Communications, 10(1), 4844. Retrieved June 21, 2020, from http://www.nature.com/articles/s41467-019-12808-z
-
Muis, S., Verlaan, M., Winsemius, H. C., Aerts, J. C. J. H. & Ward, P. J. (2016). A Global Reanalysis of Storm Surges and Extreme Sea Levels. Nature Communications, 7.


![The Statistics of Biodiversity Loss [2020 WWF Report]](https://earth.org/wp-content/uploads/2020/12/lprwinkyTHB-544x306.jpg)


