

Manila is sinking. Will it succumb to rising sea levels? There are few cities as vulnerable to sea level rise as metropolitan Manila, lying partly beneath sea level due to intense groundwater pumping. As sea levels rise, the 14 million inhabitants of Manila become more exposed, and preventive measures that aren’t adequate today will be insignificant unless action is taken.
Earth.Org has mapped the high-level flood potential the low-lying city could suffer by 2100.
—
When talking about rising sea levels, the challenge is sometimes to raise awareness of a problem that has yet to affect the citizens’ daily lives. This is not the case in Manila, where severe flooding happens frequently. The Philippines is one of the most disaster-prone countries in the world, experiencing more than 20 typhoons a year.
The majority of the city’s drainage systems are sub-par, and cannot evacuate water from heavy rainfall fast enough to avoid flooding. Water subsidence took an average of 18.5 minutes in 2017, and 30 minutes in 2018, so things are getting worse. Why? The Metropolitan Manila Development Authority (MMDA) admitted in 2019 that 60% of the drainage systems were clogged and silted. Moreover, The Commission on Audit found that only 53 of the 170 flood prevention programs in 2018 were completed.
Worse yet, short-sighted policy-making has allowed rapid groundwater drainage, causing the city to sag into a bowl-like shape. Many of Manila’s citizens live in poor conditions, with an estimated 3 million people in informal settlements (shantytowns). Moving away would mean losing their jobs and access to healthcare and other benefits from city infrastructure.
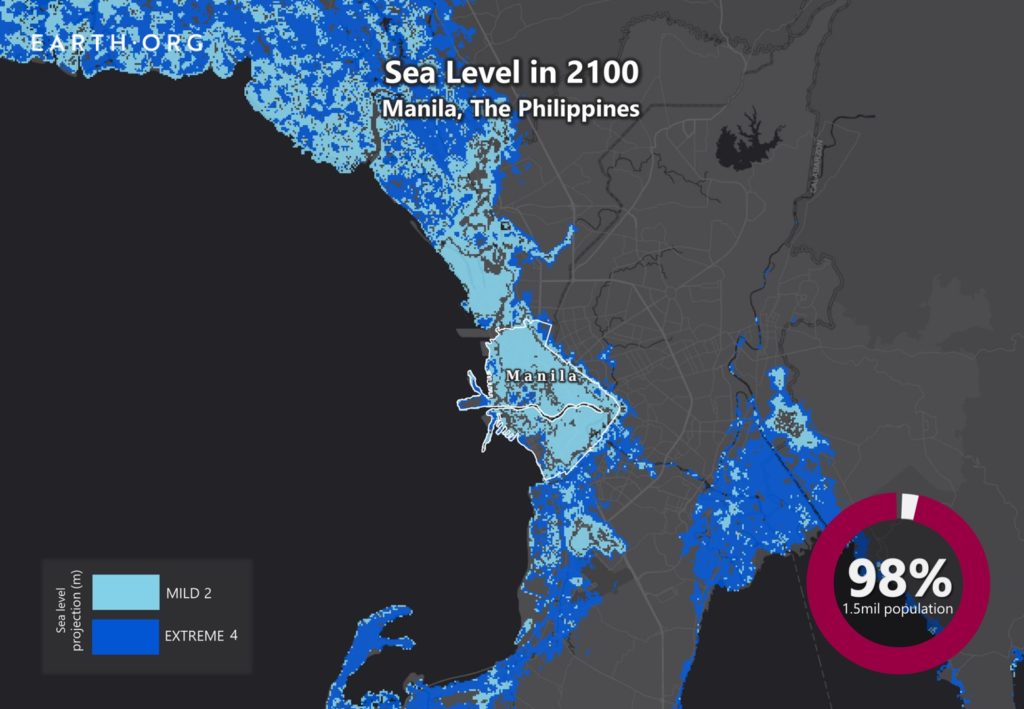
Projected sea level rise will amplify the threats of material damage and population displacement Manila’s floods already present. We illustrate what some of these extreme flooding events could look like by 2100 below.

Sea level rise projections by 2100 for two scenarios with the amount of rise indicated in meters (mild = 2m; extreme = 4m). Percentage and total population displacement indicated bottom right.
Sea Level Rise Methodology
Global mean sea level is projected to rise by 2m at the end of this century. However, in order to determine local sea level rise (SLR), one has to take into account local coastal flood levels which could be 2.8m above Mean Higher-High Water (MHHW) at extreme forecasts. These local levels bring variability to the projected SLR from 1m to 6.5m (eg. Rio vs Kolkata).
The SLR scenarios used in this study are based on the forecasts from Climate Central – Coastal Risk Screening Tool with the following parameters:
- Sea level Projection Source
- Coastal Flood Level
- Pollution Scenario
- Luck
Sea level Projection Source: is from two highly cited journals by Kopp et al., estimating SLR mainly due to ocean thermal expansion and ice melt. The mid-range scenario projected 0.5-1.2m of SLR based on different representative concentration pathways (RCP) defined by the IPCC. While the pessimistic scenario added more mechanisms of ice-sheet melting, estimating SLR at 1m-2.5m in 2100, with projection of 10m SLR at 2300.
Coastal Flooding: More frequent coastal flooding is a direct impact of sea-level rise. Based on the Global tides and surge reanalysis by Muis et al., (2016), it is estimated that the extreme coastal water level could be from 0.2 – 2.8m over mean level. While in extreme cases like China and the Netherlands it could experience 5-10m of extreme sea levels. Here, the coastal local flood level is added on top of the projected SLR.
Pollution Scenario: allows to choose the RCP, the greenhouse gas concentration trajectory defined by the IPCC. The mild level is based on RCP4.5, of 2°C temperature rise; while Extreme level is based on RCP 8.5, of 4°C temperature rise.
Luck: applies to the the baseline SLR, defined in the “Sea level projection” section, upon which we add flooding. “Mild” refers to the mid-range scenario of 0.5-1.2m, and “extreme” to the pessimistic scenario of 1-2.5m. We used the high-end value of each scenario (mild = 1m; extreme = 2.5m).
References:
-
Kulp, Scott A., and Benjamin H. Strauss. “New elevation data triple estimates of global vulnerability to sea-level rise and coastal flooding.” Nature communications 10.1 (2019): 1-12.
-
Florczyk, A. J., Corbane, C., Ehrlich, D., Freire, S., Kemper, T., Maffenini, L., Melchiorri, M., Politis, P., Schiavina, M., Sabo, F. & Zanchetta, L. (2019). GHSL Data Package 2019 Public Release.
Kopp, R. E., DeConto, R. M., Bader, D. A., Hay, C. C., Horton, R. M., Kulp, S., Oppenheimer, M., Pollard, D. & Strauss, B. H. (2017). Evolving Understanding of Antarctic Ice-Sheet Physics and Ambiguity in Probabilistic Sea-Level Projections. Earth’s Future, 5(12), 1217–1233.
Kopp, R. E., Horton, R. M., Little, C. M., Mitrovica, J. X., Oppenheimer, M., Rasmussen, D. J., Strauss, B. H. & Tebaldi, C. (2014). Probabilistic 21st and 22nd Century Sea-Level Projections at a Global Network of Tide-Gauge Sites. Earth’s Future, 2(8), 383–406.
Kulp, S. A. & Strauss, B. H. (2019). New Elevation Data Triple Estimates of Global Vulnerability to Sea-Level Rise and Coastal Flooding. Nature Communications, 10(1), 4844. Retrieved June 21, 2020, from http://www.nature.com/articles/s41467-019-12808-z
Muis, S., Verlaan, M., Winsemius, H. C., Aerts, J. C. J. H. & Ward, P. J. (2016). A Global Reanalysis of Storm Surges and Extreme Sea Levels. Nature Communications, 7.


![The Statistics of Biodiversity Loss [2020 WWF Report]](https://earth.org/wp-content/uploads/2020/12/lprwinkyTHB-544x306.jpg)


