

Venice Is Sinking Due to Sea Level Rise: Will it Go Under?
There are few cities who are as vulnerable to flooding as a result of sea level rise as Venice, with the city having experienced record floods in late 2019 that at one point submerged 70% of the city and rose to over six feet in some areas.
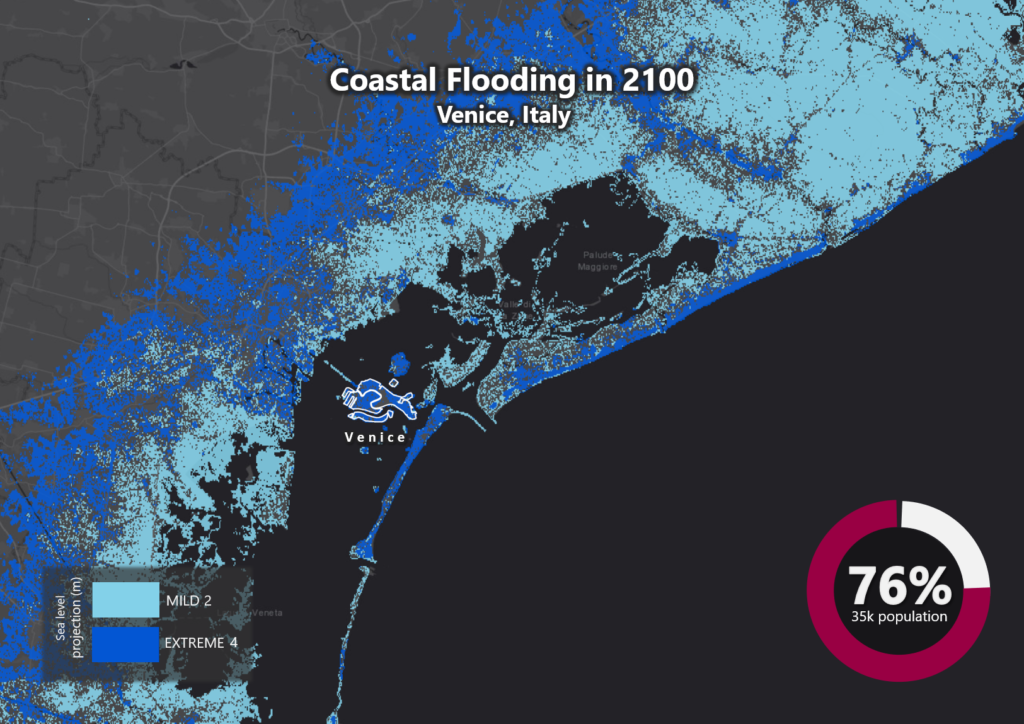
Earth.Org has mapped the high-level flood potential the low-lying Italian city and World Heritage Site could suffer by 2100.
—
“Acqua alta”- “high water” in Italian- is the term used to describe the exceptional tide peaks that occur in Venice between autumn and spring. While the Acqua Alta is periodic, its frequency has increased from under 10 times a year to over 60 in the last century.
Besides the physical flooding that affected the more than 260 000 Venetian residents, the November floods that authorities labelled as ‘apocalyptic’ caused €360 million worth of damage to public property. Priceless cultural heritage sites have also been damaged.
A recent paper published in Nature estimates that, under high emissions scenarios, global sea levels could rise by an average 1 to 2 meters by 2100. This would certainly increase the occurrence of so-called “100-year floods,” the term used to define a flood that statistically has a 1% chance of occurring in any given year. In Venice’s case, this, in addition to the already-damaging Acqua Alta, will wreak unimaginable havoc; Earth.Org has modelled what such a flood would look like.

Sea level rise projections by 2100 for two scenarios with the amount of rise in meters indicated (mild = 2m; extreme = 4m). Percentage and total population displacement indicated bottom right.
The Italian government has been conducting the MOSE project (Modulo Sperimentale Elettromeccanico, or Experimental Electromechanical Module) since 2003, which places flood barriers around the city to protect it from high waters. However, development slowed down in recent years due to corruption, lack of funding and the sheer complexity of the plan. Following the November floods, Italy has announced that it will resume the unfinished barriers and predicts that it will be completed by the end of 2021.
The climate crisis and its associated impacts- like flooding due to sea level rise, but also droughts and extreme weather events- are becoming more frequent and more intense. Melting ice sheets and the sea level rise that results from this is one such impact that is already affecting millions of people around the world.
Methodology
Global mean sea level is projected to rise by 2m at the end of this century. However, in order to determine local sea level rise (SLR), one has to take into account local coastal flood levels which could be 2.8m above Mean Higher-High Water (MHHW) at extreme forecasts. These local levels bring variability to the projected SLR from 1m to 6.5m (eg. Rio vs Kolkata).
The SLR scenarios used in this study are based on the forecasts from Climate Central – Coastal Risk Screening Tool with the following parameters:
- Sea level Projection Source
- Coastal Flood Level
- Pollution Scenario
- Luck
Sea level Projection Source: is from two highly cited journals by Kopp et al., estimating SLR mainly due to ocean thermal expansion and ice melt. The mid-range scenario projected 0.5-1.2m of SLR based on different representative concentration pathways (RCP) defined by the IPCC. While the pessimistic scenario added more mechanisms of ice-sheet melting, estimating SLR at 1m-2.5m in 2100, with projection of 10m SLR at 2300.
Coastal Flooding: More frequent coastal flooding is a direct impact of sea-level rise. Based on the Global tides and surge reanalysis by Muis et al., (2016), it is estimated that the extreme coastal water level could be from 0.2 – 2.8m over mean level. While in extreme cases like China and the Netherlands it could experience 5-10m of extreme sea levels. Here, the coastal local flood level is added on top of the projected SLR.
Pollution Scenario: allows to choose the RCP, the greenhouse gas concentration trajectory defined by the IPCC. The mild level is based on RCP4.5, of 2°C temperature rise; while Extreme level is based on RCP 8.5, of 4°C temperature rise.
Luck: applies to the the baseline SLR, defined in the “Sea level projection” section, upon which we add flooding. “Mild” refers to the mid-range scenario of 0.5-1.2m, and “extreme” to the pessimistic scenario of 1-2.5m. We used the high-end value of each scenario (mild = 1m; extreme = 2.5m).
References:
-
Kulp, Scott A., and Benjamin H. Strauss. “New elevation data triple estimates of global vulnerability to sea-level rise and coastal flooding.” Nature communications 10.1 (2019): 1-12.
-
Florczyk, A. J., Corbane, C., Ehrlich, D., Freire, S., Kemper, T., Maffenini, L., Melchiorri, M., Politis, P., Schiavina, M., Sabo, F. & Zanchetta, L. (2019). GHSL Data Package 2019 Public Release.
-
Kopp, R. E., DeConto, R. M., Bader, D. A., Hay, C. C., Horton, R. M., Kulp, S., Oppenheimer, M., Pollard, D. & Strauss, B. H. (2017). Evolving Understanding of Antarctic Ice-Sheet Physics and Ambiguity in Probabilistic Sea-Level Projections. Earth’s Future, 5(12), 1217–1233.
-
Kopp, R. E., Horton, R. M., Little, C. M., Mitrovica, J. X., Oppenheimer, M., Rasmussen, D. J., Strauss, B. H. & Tebaldi, C. (2014). Probabilistic 21st and 22nd Century Sea-Level Projections at a Global Network of Tide-Gauge Sites. Earth’s Future, 2(8), 383–406.
-
Muis, S., Verlaan, M., Winsemius, H. C., Aerts, J. C. J. H. & Ward, P. J. (2016). A Global Reanalysis of Storm Surges and Extreme Sea Levels. Nature Communications, 7.


![The Statistics of Biodiversity Loss [2020 WWF Report]](https://earth.org/wp-content/uploads/2020/12/lprwinkyTHB-544x306.jpg)


