


2020 marks the 15th anniversary of the Arctic Report Card, an annual report on the environmental and climatic state of the Arctic. The report combines satellite-derived and direct physical measurements to show how the region is doing in regards to aspects like seasonal temperatures and sea ice parameters.
—
Similar to past reports, the story this year is clear. The Arctic is getting warmer, and while most telling trends continued steadily, certain observed extremes lend the fragile region a sort of low, looming murmur of peril (ref. 1).
Sea Ice and Air Temperatures
Largely driving the Arctic’s transformation are changes in sea ice and surface air temperatures.
In 2020, sea ice extent across the Arctic continued the decreasing trend seen in the past four decades since records began. The minimum extent, reached after the summer months around September, was only second to the record low observed in 2012 and fell below that year’s extent for moments in July and November (Figure 1).
Satellite-based analyses have been tracking sea ice thickness since 2010, and, while this monitoring is only a decade in progress, this year’s levels were also among the lowest recorded.

Figure 1. Arctic Sea Ice Extent in 2020 (blue line); the 1981-2010 average range (grey band); 1979, when records began (red line); and 2012, when extent hit a record low (red dashed line). Source: National Snow and Ice Data Center.
Surface air temperatures, SAT, are closely tied to sea ice extent, and this year they were the second highest since records began in 1900. The average over the year was 1.9°C above the 1981-2010 benchmark average. It was the ninth year out of the past ten with temperatures at least 1°C warmer than average.
Sea surface temperatures, SST, were similarly high this year, at some points up to 3°C above average.
Feedback Loops
The relationships between sea ice, SAT and SST are textbook examples of feedback loops, processes where the result of one event circles back to further drive itself or another related event.
If SATs rise, sea ice melts. If sea ice melts, SATs rise.
If sea ice melts, the ocean surface is exposed to and absorbs more heat from the sun, raising SSTs. Then, when SSTs rise, more sea ice melts.
What concerns scientists is that such feedback loops accelerate as they go on, conceivably to someday reach a tipping point after which an environment can never go back to its original state.
The Laptev Sea
The most pronounced warming this year took place in the Eurasian Arctic around the Laptev and Kara Seas (Figure 2). Some days in June saw SATs up to 8°C warmer than average, with Siberia experiencing a prolonged heat wave that peaked that month at 38°C (refs. 2; 3).

Figure 2. Arctic air temperature anomalies, in °C, measured at about 760m above sea level, for June 2020. Source: NOAA Earth System Research Laboratory Physical Sciences Division
This coincided with the lowest sea ice extent ever recorded in the Russian High Arctic, along with exceptionally warm SSTs throughout the summer (Figure 3). Terrestrial snow cover in the region was also at its lowest level since records began in 1967.
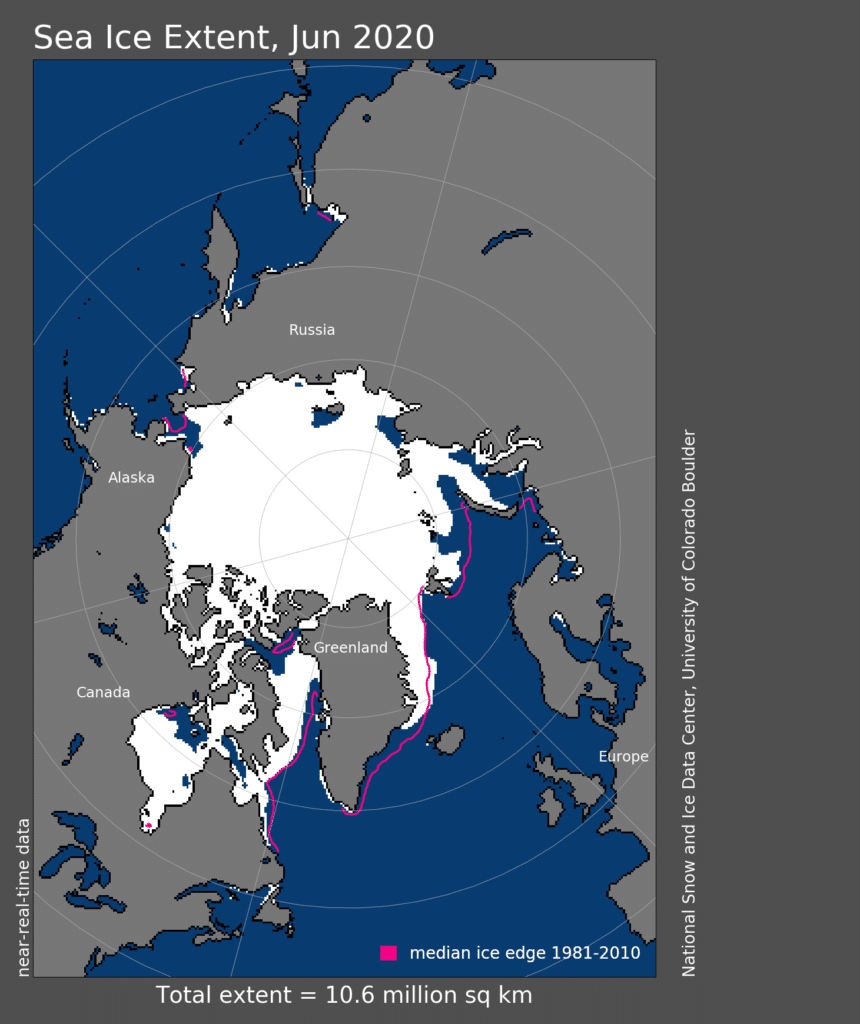
Figure 3. Arctic Sea Ice extent on June 2020, when levels were at record lows in the Laptev Sea. Source: National Snow and Ice Data Center
Arctic Wildfires
Especially notable this year was how these extremes allowed the optimal conditions for another, dire feedback loop input: wildfires.
Warmer air and drier vegetation fueled an unprecedented fire season in the first half of 2020 in the Russian Sakha Republic, which forms the southern coast of the Laptev Sea (Figure 4). Over 8000 fires were detected between May and July — the previous two years saw only around 1200 combined (ref. 2).
Burn areas in 2020 were nearly 25000 km2, an area similar to the size of the US state of Vermont.
As these high-latitude forests burn, they emit black carbon, which lands on Arctic ice and snow, decreasing its ability to reflect sunlight and making it warm and melt faster. Then the emissions themselves contribute to the enhanced global greenhouse effect.
A warmer Arctic then induces more wildfires, and the feedbacks go on and on.

Figure 4. Smoke from the Sakha Republic wildfires blowing towards sea ice in the Laptev Sea, July 2020. Source: NASA WorldView
The Arctic Report Card presents sixteen essays that detail updates on a number of environmental and ecological features, from atmospheric conditions to the status of the bowhead whale. In all this research and meticulous analysis, it is now an unsurprising fact that the Arctic is changing.
The hastened pace of this change is nonetheless striking with every new documented year.
This article was written by Debbie Sanchez. Cover photo by Annie Spratt on Unsplash.
You might also like: Air pollution and oxidative potential: A better way to regulate aerosols?
References
- https://arctic.noaa.gov/Report-Card/Report-Card-2020/ArtMID/7975/ArticleID/899/Executive-Summary
- http://nsidc.org/arcticseaicenews/2020/07/laptev-sea-lapping-up-the-heat-in-june/
- http://iccinet.org/burning-the-high-arctic-2020-spring-and-summer-fire-season-in-sakha-republic-a-precursor-of-fire-seasons-to-come/#:~:text=Wildfire%20complexes%20in%20this%20Arctic,than%202018%20(table%202)


![The Statistics of Biodiversity Loss [2020 WWF Report]](https://earth.org/wp-content/uploads/2020/12/lprwinkyTHB-544x306.jpg)


