


The excess of heat-trapping greenhouse gases in the atmosphere has led to an energy imbalance in the Earth’s climate system. The vast majority of this excess heat is stored in the ocean, leading to sea level rise by thermal expansion and ice melt. Ocean temperature and water table level are therefore good indicators of how climate change is progressing.
—
The first measurement of oceanic heat content was performed in 2000 (Levitus et al.), and it identified a robust warming trend from 0 to 3,000m between 1948 and 1998. Analyses since have demonstrated an acceleration in ocean warming since 1980 that has continued since, resulting in an average rate of ~5 zettaJoules per year. To put that into perspective, that’s around 1,000,000,000,000,000 lightning strikes worth of energy, or 2 Hiroshima atomic bombs per second, each year.

Global upper 2000 m OHC from 1958 through 2020. The histogram presents annual anomalies relative to a 1981−2010 baseline, with positive anomalies shown as red bars and negative anomalies as blue. Source: Cheng et al. 2020.
As we know, 2020 was tied for hottest year on record despite the slowdown in human activities due to the pandemic. This is because we are experiencing the heat trapped by 3 to 10 year old emissions, and yet it remains surprising to climate scientists because la Niña years are typically cooler than average. We know that ~90% of the heat went into the ocean, and just on cue, a team of scientists published a new assessment of oceanic heat content.
The study, released on the 29th of december 2020, used the latest measurement and analysis methods to produce its results. Though there is still quite some uncertainty due to technical limitations, the team found that warming had increased between 15 to 25 zettaJoules, or 8 to 12 Hiroshima atom bombs per second.
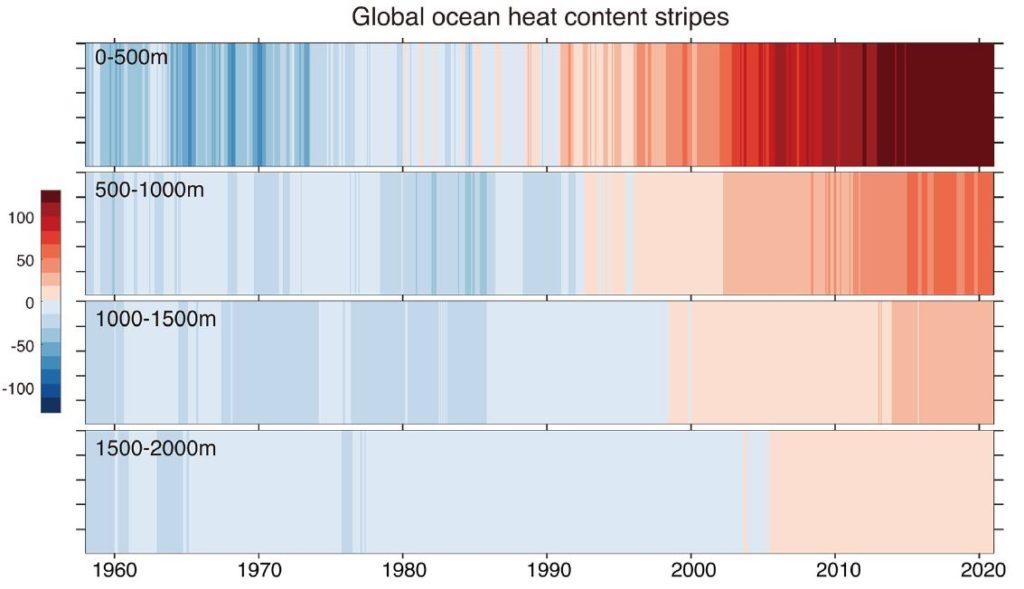
Global 0−500 m, 500−1000 m, 1000−1500 m, and 1500−2000 m OHC stripes from 1958 to 2020. Units: ZJ. Source: Cheng et al. 2020.
Most of this heat is near the surface, but some also seeps into much deeper parrots of the ocean, where many species and ecosystems are very sensitive to even slight changes. The most obvious example is that of coral reefs which have a tight temperature niche. Today, around 75% of tropical coral reefs have died off, which we call bleaching.
Sea surface temperature remains the most relevant to humans though, because it has the greatest impact on powerful weather patterns. You may have heard that extreme weather is becoming more intense, and maybe even more frequent. This is because rain patterns leading to monsoons, drought and even hurricanes are all regulated by fluctuations in the ocean’s upper layer’s temperature. As it grows warmer, it accelerates and amplifies the processes producing extreme events.
This means more flooding, more drought and thus more wildfires.
The ocean provides us with a crucial buffer against atmospheric warming, but we are pushing it harder than ever. Thankfully, we haven’t reached the critical point past which there is no return, but the next decade will be key in deviating from a path that is certainly leading towards just that.
This article was written by Owen Mulhern.
You might also like: Sea Ice Arches in the Arctic Becoming More Fragile
Reference:
-
Cheng, L., Abraham, J., Trenberth, K.E. et al. Upper Ocean Temperatures Hit Record High in 2020. Adv. Atmos. Sci. (2021). https://doi.org/10.1007/s00376-021-0447-x


![The Statistics of Biodiversity Loss [2020 WWF Report]](https://earth.org/wp-content/uploads/2020/12/lprwinkyTHB-544x306.jpg)


