As many have noticed, Brazil and the Amazon basin have been experiencing a deepening drought over the last decades, but floods are five times more frequent than a hundred years ago. Intensifying flood events result in casualties, property and agricultural losses, and sea level rise is expected to increase their likelihood.
Earth.Org takes a closer look.
—
The Amazon River Delta is the largest in the world by quite a wide margin. It discharges a fifth of all ocean-bound freshwater into the Atlantic, more than the next seven largest rivers combined. The low-lying wetlands around the Amazon riverbed are incredibly rich in resources and biodiversity, and provide sustenance and livelihoods to around 1.5 million locals.
Humans have often opted to develop communities around deltas, as they offer an interface between land, freshwater and the sea. The Amazon Delta is no exception, and the increasing pace of urbanization and commercial activities in the area are straining its natural resources and resilience. This is partly due to a massive influx of people from the more arid Northeast of Brazil, and other, less economically vibrant locations. While the Delta has seen less environmental degradation than other parts of the Amazon, the rapid development based around forestry and agroforestry has led to poorly developed urban settlements, sometimes lacking basic sanitation and infrastructure.
As sea level rise increases the likelihood of intense floods, many of the aforementioned agglomerations will suffer heavy damage to what infrastructure they have, and their inhabitants will risk disease from poor sewage dissemination in the flood waters and mosquito proliferation.

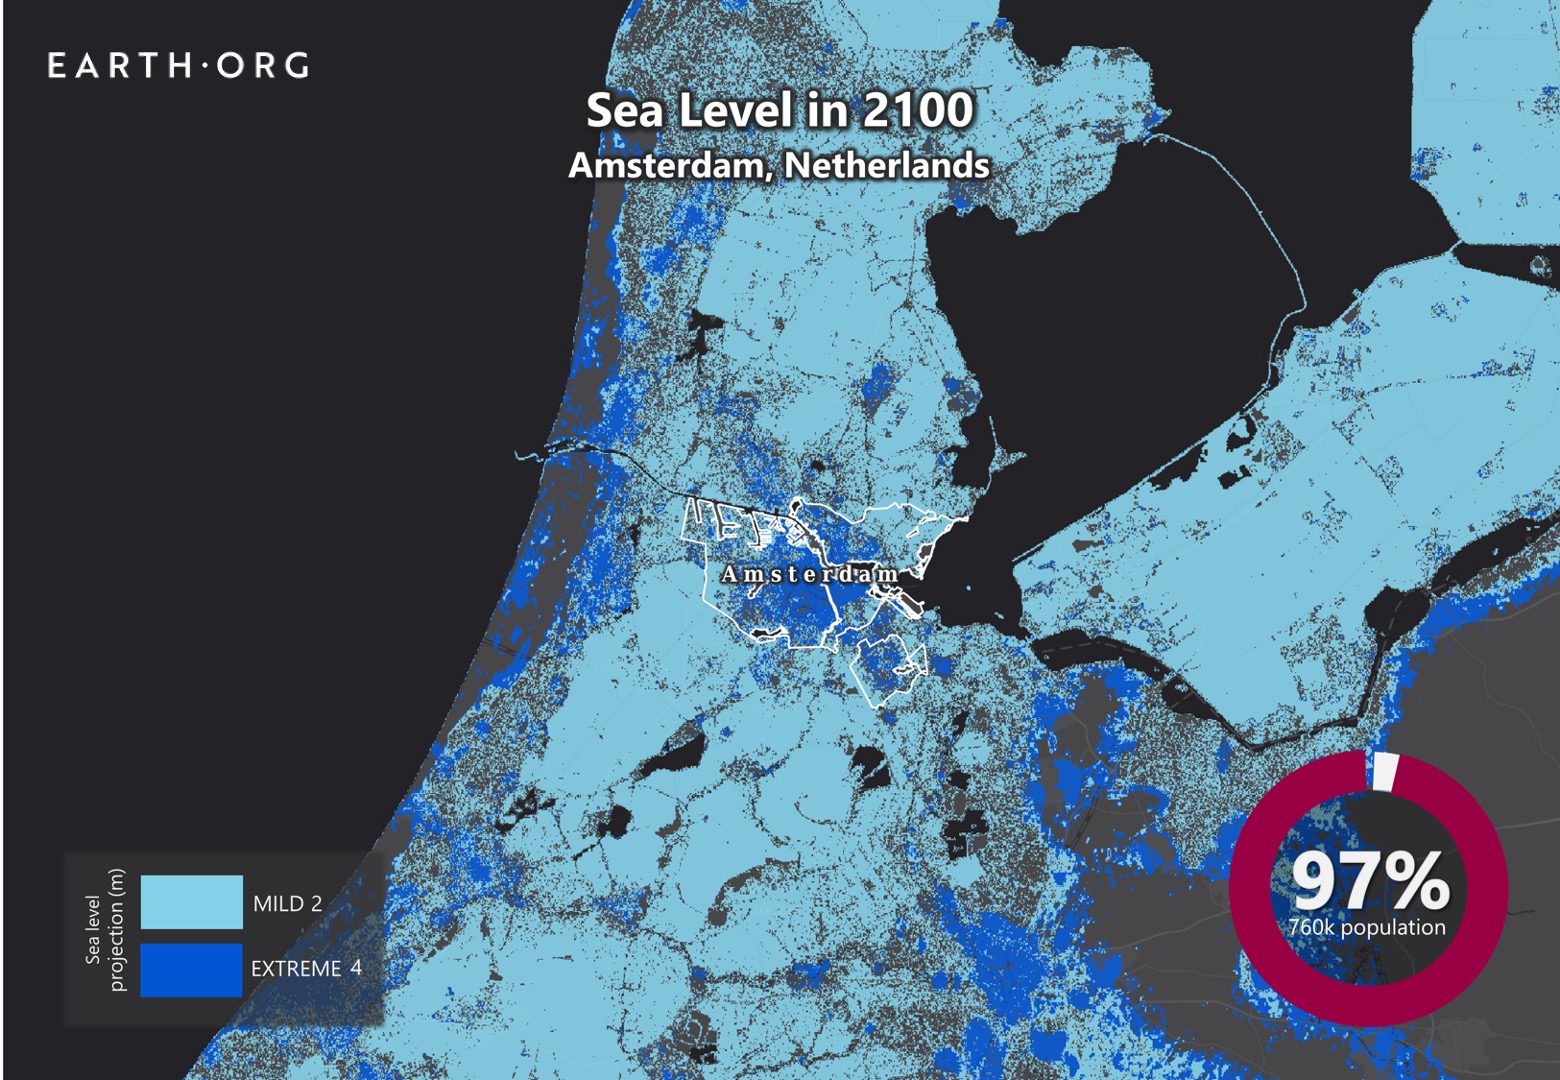
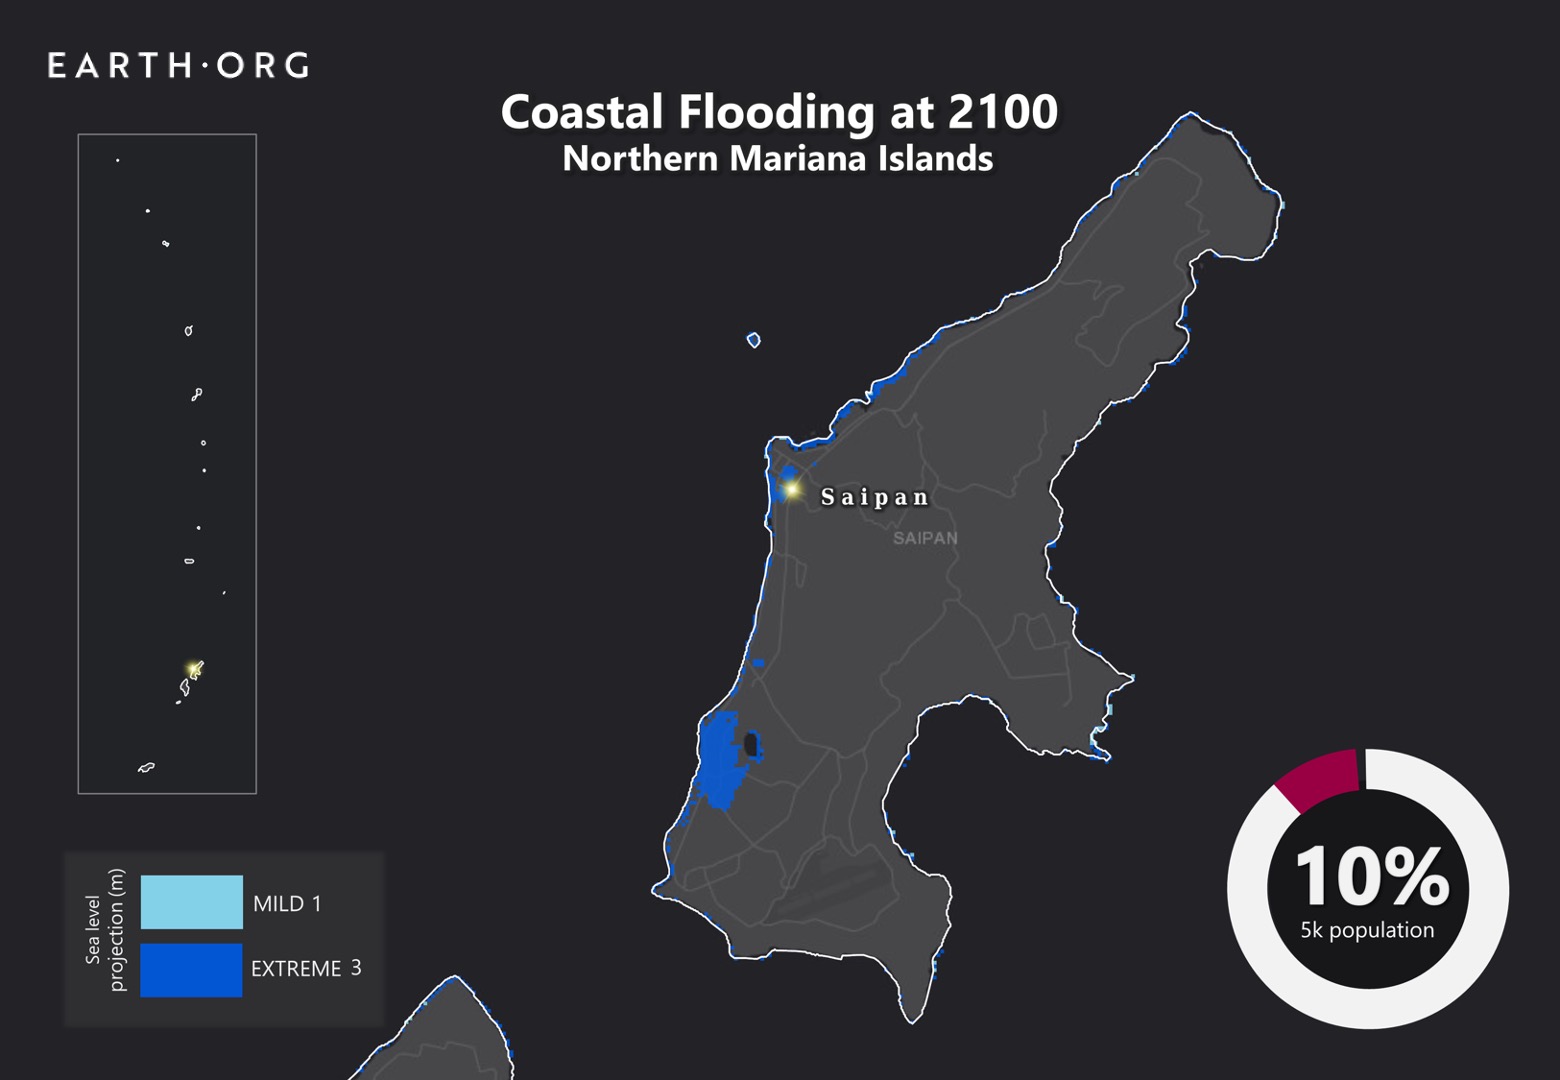
Sea level rise projections by 2100 for two scenarios with the amount of rise in meters indicated (mild = 3m; extreme = 5m). Population displacement indicated bottom right.
Sea Level Rise Methodology
Global mean sea level is projected to rise by 2m at the end of this century. However, in order to determine local sea level rise (SLR), one has to take into account local coastal flood levels which could be 2.8m above Mean Higher-High Water (MHHW) at extreme forecasts. These local levels bring variability to the projected SLR from 1m to 6.5m (eg. Rio vs Kolkata).
The SLR scenarios used in this study are based on the forecasts from Climate Central – Coastal Risk Screening Tool with the following parameters:
- Sea level Projection Source
- Coastal Flood Level
- Pollution Scenario
- Luck
Sea level Projection Source:
From two highly cited journals by Kopp et al., estimating SLR mainly due to ocean thermal expansion and ice melt. The mid-range scenario projected 0.5-1.2m of SLR based on different representative concentration pathways (RCP) defined by the IPCC. While the pessimistic scenario added more mechanisms of ice-sheet melting, estimating SLR at 1m-2.5m in 2100, with a projection of 10m SLR at 2300.
Coastal Flooding
More frequent coastal flooding is a direct impact of sea-level rise. Based on the Global tides and surge reanalysis by Muis et al., (2016), it is estimated that the extreme coastal water level could be from 0.2 – 2.8m over the mean level. While in extreme cases like China and the Netherlands it could experience 5-10m of extreme sea levels. Here, the coastal local flood level is added on top of the projected SLR.
Pollution Scenario:
Allows choosing the RCP, the greenhouse gas concentration trajectory defined by the IPCC. The mild level is based on RCP4.5, of 2°C temperature rise; while the Extreme level is based on RCP 8.5, of 4°C temperature rise.
Luck:
Applies to the baseline SLR, defined in the “Sea level projection” section, upon which we add flooding. “Mild” refers to the mid-range scenario of 0.5-1.2m, and “extreme” to the pessimistic scenario of 1-2.5m. We used the high-end value of each scenario (mild = 1m; extreme = 2.5m).
You might also like: Sea Level Rise by 2100 – The Persian Gulf
References:
-
Kulp, Scott A., and Benjamin H. Strauss. “New elevation data triple estimates of global vulnerability to sea-level rise and coastal flooding.” Nature communications 10.1 (2019): 1-12.
-
Florczyk, A. J., Corbane, C., Ehrlich, D., Freire, S., Kemper, T., Maffenini, L., Melchiorri, M., Politis, P., Schiavina, M., Sabo, F. & Zanchetta, L. (2019). GHSL Data Package 2019 Public Release.
-
Kopp, R. E., DeConto, R. M., Bader, D. A., Hay, C. C., Horton, R. M., Kulp, S., Oppenheimer, M., Pollard, D. & Strauss, B. H. (2017). Evolving Understanding of Antarctic Ice-Sheet Physics and Ambiguity in Probabilistic Sea-Level Projections. Earth’s Future, 5(12), 1217–1233.
-
Kopp, R. E., Horton, R. M., Little, C. M., Mitrovica, J. X., Oppenheimer, M., Rasmussen, D. J., Strauss, B. H. & Tebaldi, C. (2014). Probabilistic 21st and 22nd Century Sea-Level Projections at a Global Network of Tide-Gauge Sites. Earth’s Future, 2(8), 383–406.
-
Kulp, S. A. & Strauss, B. H. (2019). New Elevation Data Triple Estimates of Global Vulnerability to Sea-Level Rise and Coastal Flooding. Nature Communications, 10(1), 4844. Retrieved June 21, 2020, from http://www.nature.com/articles/s41467-019-12808-z
-
Muis, S., Verlaan, M., Winsemius, H. C., Aerts, J. C. J. H. & Ward, P. J. (2016). A Global Reanalysis of Storm Surges and Extreme Sea Levels. Nature Communications, 7.
-
Costa, Sandra Maria Fonseca da, Monique Bruna Silva do Carmo, and Paulo Roxo Barja. “The urban hierarchy at the delta of the Amazon River and the importance of small cities.” urbe. Revista Brasileira de Gestão Urbana 11 (2019).