Sign Up
Earth.Org Newsletters

Sign up to our weekly easy-to-digest recap of climate news from around the world.

Earth.Org PAST · PRESENT · FUTURE

Located in the western Pacific Ocean, Guam is regularly exposed to typhoons that flood low-lying coastal areas. What is now a nuisance could become a serious problem due to sea level rise.

Earth.Org takes a closer look.

—

Guam features a mountainous topography, with its population concentrated on the lower-lying coastal areas. It is the nearest landmass to the Mariana Trench, deepest point of the ocean and at the intersection of two tectonic plates, making the area prone to earthquakes. Guam is therefore exposed to earthquake-provoked tsunamis along with Pacific typhoons year round. 

Since a particularly devastating typhoon in 1976, wooden buildings and infrastructure have been replaced with concrete and steel, but a 2002 super typhoon still wreaked havoc on Guam. Flash floods also ail the island, but the temporary gridlock these cause can be weathered. However, they will become more frequent with sea level rise and cause costly damage to infrastructure and homes. Guam officials would be wise to commission a risk assessment and implement flood control measures to mitigate the impacts.

Earth.Org has mapped extreme flooding in Guam by 2100 to illustrate the need for action. 
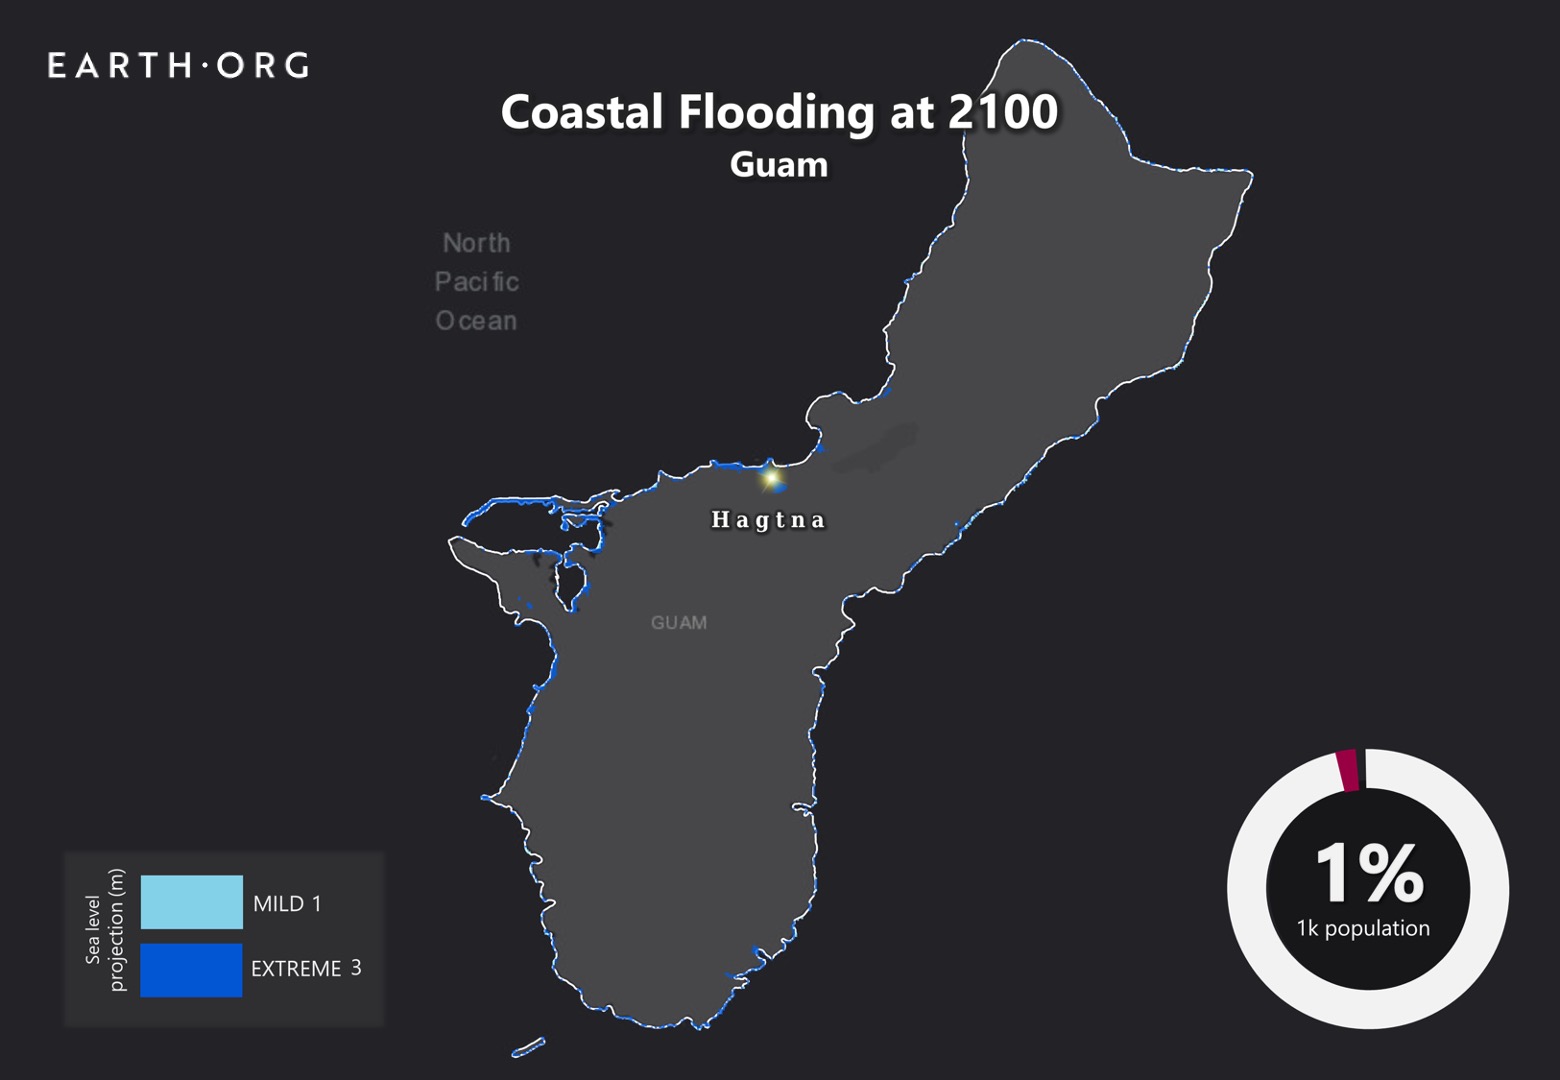
sea level rise by 2100 guam

Sea level rise projections by 2100 for two scenarios with the amount of rise in meters indicated (mild = 1m; extreme = 3m). Population displacement indicated bottom right.

Methodology

Global mean sea level is projected to rise by 2m at the end of this century. However, in order to determine local sea level rise (SLR), one has to take into account local coastal flood levels which could be 2.8m above Mean Higher-High Water (MHHW) at extreme forecasts. These local levels bring variability to the projected SLR from 1m to 6.5m (eg. Rio vs Kolkata).

The SLR scenarios used in this study are based on the forecasts from Climate Central – Coastal Risk Screening Tool  with the following parameters:

  • Sea level Projection Source
  • Coastal Flood Level
  • Pollution Scenario
  • Luck

Sea level Projection Source

From two highly cited journals by Kopp et al., estimating SLR mainly due to ocean thermal expansion and ice melt. The mid-range scenario projected 0.5-1.2m of SLR based on different representative concentration pathways (RCP) defined by the IPCC. While the pessimistic scenario added more mechanisms of ice-sheet melting, estimating SLR at 1m-2.5m in 2100, with a projection of 10m SLR at 2300.

Coastal Flooding

More frequent coastal flooding is a direct impact of sea-level rise. Based on the Global tides and surge reanalysis by Muis et al., (2016), it is estimated that the extreme coastal water level could be from 0.2 – 2.8m over the mean level. While in extreme cases like China and the Netherlands it could experience 5-10m of extreme sea levels. Here, the coastal local flood level is added on top of the projected SLR.

Pollution Scenario

Allows choosing the RCP, the greenhouse gas concentration trajectory defined by the IPCC.  The mild level is based on RCP4.5, of 2°C temperature rise; while the Extreme level is based on RCP 8.5, of 4°C temperature rise.

Luck

Applies to the baseline SLR, defined in the “Sea level projection” section, upon which we add flooding. “Mild” refers to the mid-range scenario of 0.5-1.2m, and “extreme” to the pessimistic scenario of 1-2.5m. We used the high-end value of each scenario (mild = 1m; extreme = 2.5m).

Mapping and methodology by Braundt Lau. Article written by Wing Ki Leung and Owen Mulhern.

You might also like: Sea Level Rise by 2100 – Miami


References:
  • Kulp, Scott A., and Benjamin H. Strauss. “New elevation data triple estimates of global vulnerability to sea-level rise and coastal flooding.” Nature communications 10.1 (2019): 1-12.
  • Florczyk, A. J., Corbane, C., Ehrlich, D., Freire, S., Kemper, T., Maffenini, L., Melchiorri, M., Politis, P., Schiavina, M., Sabo, F. & Zanchetta, L. (2019). GHSL Data Package 2019 Public Release.
  • Kopp, R. E., DeConto, R. M., Bader, D. A., Hay, C. C., Horton, R. M., Kulp, S., Oppenheimer, M., Pollard, D. & Strauss, B. H. (2017). Evolving Understanding of Antarctic Ice-Sheet Physics and Ambiguity in Probabilistic Sea-Level Projections. Earth’s Future, 5(12), 1217–1233.
  • Kopp, R. E., Horton, R. M., Little, C. M., Mitrovica, J. X., Oppenheimer, M., Rasmussen, D. J., Strauss, B. H. & Tebaldi, C. (2014). Probabilistic 21st and 22nd Century Sea-Level Projections at a Global Network of Tide-Gauge Sites. Earth’s Future, 2(8), 383–406.
  • Kulp, S. A. & Strauss, B. H. (2019). New Elevation Data Triple Estimates of Global Vulnerability to Sea-Level Rise and Coastal Flooding. Nature Communications, 10(1), 4844. Retrieved June 21, 2020, from http://www.nature.com/articles/s41467-019-12808-z
  • Muis, S., Verlaan, M., Winsemius, H. C., Aerts, J. C. J. H. & Ward, P. J. (2016). A Global Reanalysis of Storm Surges and Extreme Sea Levels. Nature Communications, 7.

Samoa’s climate is dependent on the South Pacific Convergence Zone and the El Nino-Southern Oscillation. They can bring both floods and droughts that heavily impact Samoan livelihood, and sea level rise threatens to exacerbate these events.

Earth.Org has mapped severe flooding in Samoa by 2100 as a result of sea level rise and coastal flooding.

—

Consisting of two main islands, Savai’i and Upolu, Samoa is an independent island state that sits about halfway between Hawaii and New Zealand. It is around 2,800 km2 with a mountainous topology, forcing most of the activity onto the coastline. Tropical cyclones affect the island between November and April, with 52 cyclones recorded between 1969 and 2010. These can be devastating to homes and infrastructure, and the accompanying floods cause landslides and put cities into gridlock.

A recent study estimated that sea level rise around Samoa is occurring ~5 times faster than the global average due to earthquake-related subsidence. There have already been waves of relocation inland as coastlines get eroded by cyclones and subsequent waves surges, and the entire island will have to adapt in the face of rising sea levels. 

As of today, protection strategies are limited to promoting coral regrowth as reefs slow down storm surges, and providing easy access to high grounds for the citizens. Unfortunately, if we go down a high emissions pathway, the low-end estimate of 1 meter of sea level rise could be too much to handle for the Samoans. 

Earth.org has mapped a worst-case scenario flood in Samoa by 2100 as a call to action.

sea level rise by 2100 samoa

Sea level rise projections by 2100 for two scenarios with the amount of rise in meters indicated (mild = 1m; extreme = 3m). Population displacement indicated bottom right.

Methodology

Global mean sea level is projected to rise by 2m at the end of this century. However, in order to determine local sea level rise (SLR), one has to take into account local coastal flood levels which could be 2.8m above Mean Higher-High Water (MHHW) at extreme forecasts. These local levels bring variability to the projected SLR from 1m to 6.5m (eg. Rio vs Kolkata).

The SLR scenarios used in this study are based on the forecasts from Climate Central – Coastal Risk Screening Tool  with the following parameters:

  • Sea level Projection Source
  • Coastal Flood Level
  • Pollution Scenario
  • Luck

Sea level Projection Source

From two highly cited journals by Kopp et al., estimating SLR mainly due to ocean thermal expansion and ice melt. The mid-range scenario projected 0.5-1.2m of SLR based on different representative concentration pathways (RCP) defined by the IPCC. While the pessimistic scenario added more mechanisms of ice-sheet melting, estimating SLR at 1m-2.5m in 2100, with a projection of 10m SLR at 2300.

Coastal Flooding

More frequent coastal flooding is a direct impact of sea-level rise. Based on the Global tides and surge reanalysis by Muis et al., (2016), it is estimated that the extreme coastal water level could be from 0.2 – 2.8m over the mean level. While in extreme cases like China and the Netherlands it could experience 5-10m of extreme sea levels. Here, the coastal local flood level is added on top of the projected SLR.

Pollution Scenario

Allows choosing the RCP, the greenhouse gas concentration trajectory defined by the IPCC.  The mild level is based on RCP4.5, of 2°C temperature rise; while the Extreme level is based on RCP 8.5, of 4°C temperature rise.

Luck

Applies to the baseline SLR, defined in the “Sea level projection” section, upon which we add flooding. “Mild” refers to the mid-range scenario of 0.5-1.2m, and “extreme” to the pessimistic scenario of 1-2.5m. We used the high-end value of each scenario (mild = 1m; extreme = 2.5m).

Mapping and methodology by Braundt Lau. Article written by Wing Ki Leung and Owen Mulhern.

You might also like: Sea Level Rise by 2100 – Miami


References:
  • Kulp, Scott A., and Benjamin H. Strauss. “New elevation data triple estimates of global vulnerability to sea-level rise and coastal flooding.” Nature communications 10.1 (2019): 1-12.
  • Florczyk, A. J., Corbane, C., Ehrlich, D., Freire, S., Kemper, T., Maffenini, L., Melchiorri, M., Politis, P., Schiavina, M., Sabo, F. & Zanchetta, L. (2019). GHSL Data Package 2019 Public Release.
  • Kopp, R. E., DeConto, R. M., Bader, D. A., Hay, C. C., Horton, R. M., Kulp, S., Oppenheimer, M., Pollard, D. & Strauss, B. H. (2017). Evolving Understanding of Antarctic Ice-Sheet Physics and Ambiguity in Probabilistic Sea-Level Projections. Earth’s Future, 5(12), 1217–1233.
  • Kopp, R. E., Horton, R. M., Little, C. M., Mitrovica, J. X., Oppenheimer, M., Rasmussen, D. J., Strauss, B. H. & Tebaldi, C. (2014). Probabilistic 21st and 22nd Century Sea-Level Projections at a Global Network of Tide-Gauge Sites. Earth’s Future, 2(8), 383–406.
  • Kulp, S. A. & Strauss, B. H. (2019). New Elevation Data Triple Estimates of Global Vulnerability to Sea-Level Rise and Coastal Flooding. Nature Communications, 10(1), 4844. Retrieved June 21, 2020, from http://www.nature.com/articles/s41467-019-12808-z
  • Muis, S., Verlaan, M., Winsemius, H. C., Aerts, J. C. J. H. & Ward, P. J. (2016). A Global Reanalysis of Storm Surges and Extreme Sea Levels. Nature Communications, 7.

A 2009 earthquake wreaked havoc in American Samoa, but damage extended beyond immediate impacts. Since the event, the island has begun to subside, magnifying the effects of sea level rise. 

Earth.Org takes a closer look. 

—

American Samoa is located in the south-central Pacific Ocean, halfway between New Zealand and Hawaii. Before the magnitude 8.1 earthquake in 2009, the sea level around American Samoa climbed 2 to 3 millimeters per year, which is approximately the global average. However, since the incident, American Samoa’s submersion rate has increased to 5 times that of the global average.

Scientists explain that American Samoa’s subsidence is due to its location around the fault zone. The afore-mentioned earthquake triggered tectonic mechanics that are causing the crust to slowly sink. Interestingly, in Samoa, which is merely 164 kilometers away from American Samoa, tectonic shifts push the island both horizontally and vertically at equal rates, hence slowing down the rate of sea level rise.

Extreme weather events occur regularly in this part of the Pacific, and floods can be a dangerous nuisance. Sea level rise increases the likelihood and worsens the effect of floods, and coastal cities all over the world are in a race against time to adapt. American Samoa is particularly vulnerable, and officials only recently became aware that they have less time than most to do so. 

Earth.Org has mapped what extreme flooding would be like in American Samoa by 2100 to illustrate the need for action. 

sea level rise by 2100 american samoa

Sea level rise projections by 2100 for two scenarios with the amount of rise in meters indicated (mild = 2m; extreme = 4m). Population displacement indicated bottom right.

Methodology

Global mean sea level is projected to rise by 2m at the end of this century. However, in order to determine local sea level rise (SLR), one has to take into account local coastal flood levels which could be 2.8m above Mean Higher-High Water (MHHW) at extreme forecasts. These local levels bring variability to the projected SLR from 1m to 6.5m (eg. Rio vs Kolkata).

The SLR scenarios used in this study are based on the forecasts from Climate Central – Coastal Risk Screening Tool  with the following parameters:

  • Sea level Projection Source
  • Coastal Flood Level
  • Pollution Scenario
  • Luck

Sea level Projection Source:

From two highly cited journals by Kopp et al., estimating SLR mainly due to ocean thermal expansion and ice melt. The mid-range scenario projected 0.5-1.2m of SLR based on different representative concentration pathways (RCP) defined by the IPCC. While the pessimistic scenario added more mechanisms of ice-sheet melting, estimating SLR at 1m-2.5m in 2100, with a projection of 10m SLR at 2300.

Coastal Flooding

More frequent coastal flooding is a direct impact of sea-level rise. Based on the Global tides and surge reanalysis by Muis et al., (2016), it is estimated that the extreme coastal water level could be from 0.2 – 2.8m over the mean level. While in extreme cases like China and the Netherlands it could experience 5-10m of extreme sea levels. Here, the coastal local flood level is added on top of the projected SLR.

Pollution Scenario:

Allows choosing the RCP, the greenhouse gas concentration trajectory defined by the IPCC.  The mild level is based on RCP4.5, of 2°C temperature rise; while the Extreme level is based on RCP 8.5, of 4°C temperature rise.

Luck:

Applies to the baseline SLR, defined in the “Sea level projection” section, upon which we add flooding. “Mild” refers to the mid-range scenario of 0.5-1.2m, and “extreme” to the pessimistic scenario of 1-2.5m. We used the high-end value of each scenario (mild = 1m; extreme = 2.5m).

You might also like: Sea Level Rise by 2100 – New York City

References:
  • Kulp, Scott A., and Benjamin H. Strauss. “New elevation data triple estimates of global vulnerability to sea-level rise and coastal flooding.” Nature communications 10.1 (2019): 1-12.
  • Florczyk, A. J., Corbane, C., Ehrlich, D., Freire, S., Kemper, T., Maffenini, L., Melchiorri, M., Politis, P., Schiavina, M., Sabo, F. & Zanchetta, L. (2019). GHSL Data Package 2019 Public Release.
  • Kopp, R. E., DeConto, R. M., Bader, D. A., Hay, C. C., Horton, R. M., Kulp, S., Oppenheimer, M., Pollard, D. & Strauss, B. H. (2017). Evolving Understanding of Antarctic Ice-Sheet Physics and Ambiguity in Probabilistic Sea-Level Projections. Earth’s Future, 5(12), 1217–1233.
  • Kopp, R. E., Horton, R. M., Little, C. M., Mitrovica, J. X., Oppenheimer, M., Rasmussen, D. J., Strauss, B. H. & Tebaldi, C. (2014). Probabilistic 21st and 22nd Century Sea-Level Projections at a Global Network of Tide-Gauge Sites. Earth’s Future, 2(8), 383–406.
  • Kulp, S. A. & Strauss, B. H. (2019). New Elevation Data Triple Estimates of Global Vulnerability to Sea-Level Rise and Coastal Flooding. Nature Communications, 10(1), 4844. Retrieved June 21, 2020, from http://www.nature.com/articles/s41467-019-12808-z
  • Muis, S., Verlaan, M., Winsemius, H. C., Aerts, J. C. J. H. & Ward, P. J. (2016). A Global Reanalysis of Storm Surges and Extreme Sea Levels. Nature Communications, 7.

New Caledonia is a French overseas territory in the South Pacific. Like many island states, its inhabitants and unique species are increasingly threatened by rapid sea level rise. 

Earth.Org has mapped what extreme flooding could look like by 2100 to illustrate the need for action.

—

Ouvéa, nicknamed “the island closest to paradise”, is considered to be one of the most beautiful atolls of the New Caledonian and Pacific group of islands. The archipelago has a population of about 259,000, 100,237 of whom live in the capital, Noumea. They are surrounded by varied microclimates, hidden in plains, lagoons and mountains, allowing a multitude of unique species to flourish.

Rising sea levels are accelerating coastal erosion, endangering habitats and forcing local tribes to adapt their daily lives. Although many homes are within reach of the creeping waters, crops are still safe. When this is no longer the case, survival on the islands will become seriously difficult.

Recent studies have highlighted a possible sea level rise of 1 to 2 meters by 2100 with current emission patterns. A single meter means the loss of 1.7 to 2% of the island’s land surface (out of a total of 54% that is not mountains or forests). Erosion is also eroding New Caledonia’s coastline, and if the inhabitants do not begin to defend themselves soon, they may lose a lot of space over the next few decades.

Today, land loss threatens to displace the tribes from the seafront and disrupt their social fabric. The island’s many different cultures will have to work together if they are to adapt to the rising waters, which means awareness and communication are key. This is also true for the global community’s confrontation with climate change as a whole.

Earth.Org has mapped the serious flooding that could occur by 2100 in New Caledonia if we do not reduce emissions. The time to act is now.

sea level rise by 2100 Noumea

Sea level rise projections by 2100 for two scenarios with the amount of rise in meters indicated (mild = 2m; extreme = 3m). Population displacement indicated bottom right.

Methodology

Global mean sea level is projected to rise by 2m at the end of this century. However, in order to determine local sea level rise (SLR), one has to take into account local coastal flood levels which could be 2.8m above Mean Higher-High Water (MHHW) at extreme forecasts. These local levels bring variability to the projected SLR from 1m to 6.5m (eg. Rio vs Kolkata).

The SLR scenarios used in this study are based on the forecasts from Climate Central – Coastal Risk Screening Tool  with the following parameters:

  • Sea level Projection Source
  • Coastal Flood Level
  • Pollution Scenario
  • Luck

Sea level Projection Source:

From two highly cited journals by Kopp et al., estimating SLR mainly due to ocean thermal expansion and ice melt. The mid-range scenario projected 0.5-1.2m of SLR based on different representative concentration pathways (RCP) defined by the IPCC. While the pessimistic scenario added more mechanisms of ice-sheet melting, estimating SLR at 1m-2.5m in 2100, with a projection of 10m SLR at 2300.

Coastal Flooding

More frequent coastal flooding is a direct impact of sea-level rise. Based on the Global tides and surge reanalysis by Muis et al., (2016), it is estimated that the extreme coastal water level could be from 0.2 – 2.8m over the mean level. While in extreme cases like China and the Netherlands it could experience 5-10m of extreme sea levels. Here, the coastal local flood level is added on top of the projected SLR.

Pollution Scenario:

Allows choosing the RCP, the greenhouse gas concentration trajectory defined by the IPCC.  The mild level is based on RCP4.5, of 2°C temperature rise; while the Extreme level is based on RCP 8.5, of 4°C temperature rise.

Luck:

Applies to the baseline SLR, defined in the “Sea level projection” section, upon which we add flooding. “Mild” refers to the mid-range scenario of 0.5-1.2m, and “extreme” to the pessimistic scenario of 1-2.5m. We used the high-end value of each scenario (mild = 1m; extreme = 2.5m).

You might also like: Sea Level Rise by 2100 – New York City

References:
  • Kulp, Scott A., and Benjamin H. Strauss. “New elevation data triple estimates of global vulnerability to sea-level rise and coastal flooding.” Nature communications 10.1 (2019): 1-12.
  • Florczyk, A. J., Corbane, C., Ehrlich, D., Freire, S., Kemper, T., Maffenini, L., Melchiorri, M., Politis, P., Schiavina, M., Sabo, F. & Zanchetta, L. (2019). GHSL Data Package 2019 Public Release.
  • Kopp, R. E., DeConto, R. M., Bader, D. A., Hay, C. C., Horton, R. M., Kulp, S., Oppenheimer, M., Pollard, D. & Strauss, B. H. (2017). Evolving Understanding of Antarctic Ice-Sheet Physics and Ambiguity in Probabilistic Sea-Level Projections. Earth’s Future, 5(12), 1217–1233.
  • Kopp, R. E., Horton, R. M., Little, C. M., Mitrovica, J. X., Oppenheimer, M., Rasmussen, D. J., Strauss, B. H. & Tebaldi, C. (2014). Probabilistic 21st and 22nd Century Sea-Level Projections at a Global Network of Tide-Gauge Sites. Earth’s Future, 2(8), 383–406.
  • Kulp, S. A. & Strauss, B. H. (2019). New Elevation Data Triple Estimates of Global Vulnerability to Sea-Level Rise and Coastal Flooding. Nature Communications, 10(1), 4844. Retrieved June 21, 2020, from http://www.nature.com/articles/s41467-019-12808-z
  • Muis, S., Verlaan, M., Winsemius, H. C., Aerts, J. C. J. H. & Ward, P. J. (2016). A Global Reanalysis of Storm Surges and Extreme Sea Levels. Nature Communications, 7.

Tonga is an archipelago consisting of four clusters of islands, located northeast of Australia. With sea level rise at twice the global average speed, communities have already begun forced relocation.

Earth.Org takes a closer look. 

—

The Kingdom of Tonga is an archipelago, which has 169 islands and only 36 of them are continuously inhabited. The island of Tongatapu is home to Tonga’s capital, Nuku’alofa. With a population of 70,000, it is home to 80% of the country’s population. The sea level around the country has risen by about 6 millimeters per year, which is double the global average. Similar to Palau, an island nation in the Pacific, higher ground in Tonga is mountainous and unsuitable for human habitation. A lot of infrastructure at sea level must be rebuilt annually as roads and paths are washed away due to the rising sea level and higher frequency of storms.

Several communities on the smaller islands have already relocated to other islands due to rising seawater and severe coastal erosion. The Hihifo District, southeast of the capital, feels climate change’s impacts most acutely. The combination of less rainfall due to the El Nino-Southern Oscillation (ENSO) and saltwater intrusion into the groundwater aquifer has left inhabitants with very little freshwater. In Ha’apai, a group of islands south of Tongatapu, coastal erosion has carved up to 40 meters of land off the island.

In 2010, the Tongan government developed a 5 years joint national action plan, Pacific Adaptation to Climate Change (PACC), that focuses mainly on water quality and access. Most Tongans remain vulnerable to displacement as they continue to lose ground to the ocean. It may not be feasible for the government to create a long-lasting defense for its people, in which cases Tongans may soon become a nation of climate refugees, likely moving toward New Zealand and Australia.

Earth.Org has modelled severe flooding in Tonga by 2100 to illustrate the urgent need for action today. 

sea level rise by 2100 tonga

Sea level rise projections by 2100 for two scenarios with the amount of rise in meters indicated (mild = 1m; extreme = 4m). Population displacement indicated bottom right.

Methodology

Global mean sea level is projected to rise by 2m at the end of this century. However, in order to determine local sea level rise (SLR), one has to take into account local coastal flood levels which could be 2.8m above Mean Higher-High Water (MHHW) at extreme forecasts. These local levels bring variability to the projected SLR from 1m to 6.5m (eg. Rio vs Kolkata).

The SLR scenarios used in this study are based on the forecasts from Climate Central – Coastal Risk Screening Tool  with the following parameters:

  • Sea level Projection Source
  • Coastal Flood Level
  • Pollution Scenario
  • Luck

Sea level Projection Source

From two highly cited journals by Kopp et al., estimating SLR mainly due to ocean thermal expansion and ice melt. The mid-range scenario projected 0.5-1.2m of SLR based on different representative concentration pathways (RCP) defined by the IPCC. While the pessimistic scenario added more mechanisms of ice-sheet melting, estimating SLR at 1m-2.5m in 2100, with a projection of 10m SLR at 2300.

Coastal Flooding

More frequent coastal flooding is a direct impact of sea-level rise. Based on the Global tides and surge reanalysis by Muis et al., (2016), it is estimated that the extreme coastal water level could be from 0.2 – 2.8m over the mean level. While in extreme cases like China and the Netherlands it could experience 5-10m of extreme sea levels. Here, the coastal local flood level is added on top of the projected SLR.

Pollution Scenario

Allows choosing the RCP, the greenhouse gas concentration trajectory defined by the IPCC.  The mild level is based on RCP4.5, of 2°C temperature rise; while the Extreme level is based on RCP 8.5, of 4°C temperature rise.

Luck

Applies to the baseline SLR, defined in the “Sea level projection” section, upon which we add flooding. “Mild” refers to the mid-range scenario of 0.5-1.2m, and “extreme” to the pessimistic scenario of 1-2.5m. We used the high-end value of each scenario (mild = 1m; extreme = 2.5m).

Mapping and methodology by Braundt Lau. Article written by Wing Ki Leung and Owen Mulhern.

You might also like: Sea Level Rise by 2100 – Miami


References:
  • Kulp, Scott A., and Benjamin H. Strauss. “New elevation data triple estimates of global vulnerability to sea-level rise and coastal flooding.” Nature communications 10.1 (2019): 1-12.
  • Florczyk, A. J., Corbane, C., Ehrlich, D., Freire, S., Kemper, T., Maffenini, L., Melchiorri, M., Politis, P., Schiavina, M., Sabo, F. & Zanchetta, L. (2019). GHSL Data Package 2019 Public Release.
  • Kopp, R. E., DeConto, R. M., Bader, D. A., Hay, C. C., Horton, R. M., Kulp, S., Oppenheimer, M., Pollard, D. & Strauss, B. H. (2017). Evolving Understanding of Antarctic Ice-Sheet Physics and Ambiguity in Probabilistic Sea-Level Projections. Earth’s Future, 5(12), 1217–1233.
  • Kopp, R. E., Horton, R. M., Little, C. M., Mitrovica, J. X., Oppenheimer, M., Rasmussen, D. J., Strauss, B. H. & Tebaldi, C. (2014). Probabilistic 21st and 22nd Century Sea-Level Projections at a Global Network of Tide-Gauge Sites. Earth’s Future, 2(8), 383–406.
  • Kulp, S. A. & Strauss, B. H. (2019). New Elevation Data Triple Estimates of Global Vulnerability to Sea-Level Rise and Coastal Flooding. Nature Communications, 10(1), 4844. Retrieved June 21, 2020, from http://www.nature.com/articles/s41467-019-12808-z
  • Muis, S., Verlaan, M., Winsemius, H. C., Aerts, J. C. J. H. & Ward, P. J. (2016). A Global Reanalysis of Storm Surges and Extreme Sea Levels. Nature Communications, 7.

Samoa’s climate is dependent on the South Pacific Convergence Zone and the El Nino-Southern Oscillation. They can bring both floods and droughts that heavily impact Samoan livelihood, and sea level rise threatens to exacerbate these events.

Earth.Org has mapped severe flooding in Samoa by 2100 as a result of sea level rise and coastal flooding.

—

Consisting of two main islands, Savai’i and Upolu, Samoa is an independent island State that sits about half way between Hawaii and New Zealand. Its 2,800 km2 area is mostly mountainous, forcing most of the activity onto the coastline. Tropical cyclones affect the island between November and April, with 52 recorded between 1969 and 2010. These can be devastating to homes and infrastructure, and the accompanying floods cause landslides and put cities into gridlock.

A recent study estimated that sea level rise around Samoa is occurring ~5 times faster than the global average due to earthquake-related subsidence. There have already been waves of relocation inland as coastlines get eroded by cyclones and subsequent waves surges, and the entire island will have to adapt in the face of rising sea levels. 

As of today, protection strategies are limited to promoting coral regrowth as reefs slow down storm surges, and providing easy access to high grounds for the citizens. Unfortunately, if we go down a high emissions pathway, the low end estimate of 1 meter of sea level rise could be too much to handle for the Samoans. 

Earth.org has mapped a worst case scenario flood in Samoa by 2100 as a call to action.

sea level rise by 2100 samoa

Sea level rise projections by 2100 for two scenarios with the amount of rise in meters indicated (mild = 1m; extreme = 3m). Percentage and total population displacement indicated bottom right.

Methodology

Global mean sea level is projected to rise by 2m at the end of this century. However, in order to determine local sea level rise (SLR), one has to take into account local coastal flood levels which could be 2.8m above Mean Higher-High Water (MHHW) at extreme forecasts. These local levels bring variability to the projected SLR from 1m to 6.5m (eg. Rio vs Kolkata).

The SLR scenarios used in this study are based on the forecasts from Climate Central – Coastal Risk Screening Tool  with the following parameters:

  • Sea level Projection Source
  • Coastal Flood Level
  • Pollution Scenario
  • Luck

Sea level Projection Source:

From two highly cited journals by Kopp et al., estimating SLR mainly due to ocean thermal expansion and ice melt. The mid-range scenario projected 0.5-1.2m of SLR based on different representative concentration pathways (RCP) defined by the IPCC. While the pessimistic scenario added more mechanisms of ice-sheet melting, estimating SLR at 1m-2.5m in 2100, with a projection of 10m SLR at 2300.

Coastal Flooding

More frequent coastal flooding is a direct impact of sea-level rise. Based on the Global tides and surge reanalysis by Muis et al., (2016), it is estimated that the extreme coastal water level could be from 0.2 – 2.8m over the mean level. While in extreme cases like China and the Netherlands it could experience 5-10m of extreme sea levels. Here, the coastal local flood level is added on top of the projected SLR.

Pollution Scenario:

Allows choosing the RCP, the greenhouse gas concentration trajectory defined by the IPCC.  The mild level is based on RCP4.5, of 2°C temperature rise; while the Extreme level is based on RCP 8.5, of 4°C temperature rise.

Luck:

Applies to the baseline SLR, defined in the “Sea level projection” section, upon which we add flooding. “Mild” refers to the mid-range scenario of 0.5-1.2m, and “extreme” to the pessimistic scenario of 1-2.5m. We used the high-end value of each scenario (mild = 1m; extreme = 2.5m).

Mapping and methodology by Braundt Lau. Article written by Jennie Wong and Owen Mulhern.

You might also like: Sea Level Rise by 2100 – New York City


References:
  • Kulp, Scott A., and Benjamin H. Strauss. “New elevation data triple estimates of global vulnerability to sea-level rise and coastal flooding.” Nature communications 10.1 (2019): 1-12.
  • Florczyk, A. J., Corbane, C., Ehrlich, D., Freire, S., Kemper, T., Maffenini, L., Melchiorri, M., Politis, P., Schiavina, M., Sabo, F. & Zanchetta, L. (2019). GHSL Data Package 2019 Public Release.
  • Kopp, R. E., DeConto, R. M., Bader, D. A., Hay, C. C., Horton, R. M., Kulp, S., Oppenheimer, M., Pollard, D. & Strauss, B. H. (2017). Evolving Understanding of Antarctic Ice-Sheet Physics and Ambiguity in Probabilistic Sea-Level Projections. Earth’s Future, 5(12), 1217–1233.
  • Kopp, R. E., Horton, R. M., Little, C. M., Mitrovica, J. X., Oppenheimer, M., Rasmussen, D. J., Strauss, B. H. & Tebaldi, C. (2014). Probabilistic 21st and 22nd Century Sea-Level Projections at a Global Network of Tide-Gauge Sites. Earth’s Future, 2(8), 383–406.
  • Kulp, S. A. & Strauss, B. H. (2019). New Elevation Data Triple Estimates of Global Vulnerability to Sea-Level Rise and Coastal Flooding. Nature Communications, 10(1), 4844. Retrieved June 21, 2020, from http://www.nature.com/articles/s41467-019-12808-z
  • Muis, S., Verlaan, M., Winsemius, H. C., Aerts, J. C. J. H. & Ward, P. J. (2016). A Global Reanalysis of Storm Surges and Extreme Sea Levels. Nature Communications, 7.

Fiji comprises 332 islands and has a large coastline that spans 1129 kilometers. Since 1993, the higher than average rate of sea level rise has made many of the islands uninhabitable. Those that remain are slowly but surely losing ground to the ocean, and their population needs to decide on whether to endure or flee. 

Earth.Org takes a closer look.

—

Suve, the capital of Fiji, is one of the largest urban centers and economic hubs in the South Pacific region. The Fijian economy is based primarily on tourism and the export of sugar cane with other activities including gold mining, fishing, and timber production. Continuous sea level rise has begun disrupting coastal activity, and will negatively impact Fiji socio-economic status in the next few decades.

Besides the economic loss, precious land is being reclaimed by the sea. Research shows that 4.5% of all the existing buildings in Fiji will be inundated by as little as 22 cm sea level rise, up to 6.2% with 63 cm rise. Considering the higher-end predictions of 1 to 2 meters by 2100, Fiji must prepare to move critical infrastructures like ports and hospitals to safer locations, and protect their freshwater reserves as saltwater threatens to contaminate their aquifers.

Officials intend to fight back through progressive relocation for communities at risk, coastal revegetation and seawalls. Hopefully, this will buy enough time to lay out a long-term solution.

Earth.Org has mapped what extreme flooding could look like in Fiji by 2100 as a call for awareness. 

sea level rise by 2100 fiji

Sea level rise projections by 2100 for two scenarios with the amount of rise in meters indicated (mild = 2m; extreme = 4m). Percentage and total population displacement indicated bottom right.

Methodology

Global mean sea level is projected to rise by 2m at the end of this century. However, in order to determine local sea level rise (SLR), one has to take into account local coastal flood levels which could be 2.8m above Mean Higher-High Water (MHHW) at extreme forecasts. These local levels bring variability to the projected SLR from 1m to 6.5m (eg. Rio vs Kolkata).

The SLR scenarios used in this study are based on the forecasts from Climate Central – Coastal Risk Screening Tool  with the following parameters:

  • Sea level Projection Source
  • Coastal Flood Level
  • Pollution Scenario
  • Luck

Sea level Projection Source:

From two highly cited journals by Kopp et al., estimating SLR mainly due to ocean thermal expansion and ice melt. The mid-range scenario projected 0.5-1.2m of SLR based on different representative concentration pathways (RCP) defined by the IPCC. While the pessimistic scenario added more mechanisms of ice-sheet melting, estimating SLR at 1m-2.5m in 2100, with a projection of 10m SLR at 2300.

Coastal Flooding

More frequent coastal flooding is a direct impact of sea-level rise. Based on the Global tides and surge reanalysis by Muis et al., (2016), it is estimated that the extreme coastal water level could be from 0.2 – 2.8m over the mean level. While in extreme cases like China and the Netherlands it could experience 5-10m of extreme sea levels. Here, the coastal local flood level is added on top of the projected SLR.

Pollution Scenario:

Allows choosing the RCP, the greenhouse gas concentration trajectory defined by the IPCC.  The mild level is based on RCP4.5, of 2°C temperature rise; while the Extreme level is based on RCP 8.5, of 4°C temperature rise.

Luck:

Applies to the baseline SLR, defined in the “Sea level projection” section, upon which we add flooding. “Mild” refers to the mid-range scenario of 0.5-1.2m, and “extreme” to the pessimistic scenario of 1-2.5m. We used the high-end value of each scenario (mild = 1m; extreme = 2.5m).

Mapping and methodology by Braundt Lau. Article written by Jennie Wong and Owen Mulhern.

You might also like: Sea Level Rise by 2100 – Miami


References:
  • Kulp, Scott A., and Benjamin H. Strauss. “New elevation data triple estimates of global vulnerability to sea-level rise and coastal flooding.” Nature communications 10.1 (2019): 1-12.
  • Florczyk, A. J., Corbane, C., Ehrlich, D., Freire, S., Kemper, T., Maffenini, L., Melchiorri, M., Politis, P., Schiavina, M., Sabo, F. & Zanchetta, L. (2019). GHSL Data Package 2019 Public Release.
  • Kopp, R. E., DeConto, R. M., Bader, D. A., Hay, C. C., Horton, R. M., Kulp, S., Oppenheimer, M., Pollard, D. & Strauss, B. H. (2017). Evolving Understanding of Antarctic Ice-Sheet Physics and Ambiguity in Probabilistic Sea-Level Projections. Earth’s Future, 5(12), 1217–1233.
  • Kopp, R. E., Horton, R. M., Little, C. M., Mitrovica, J. X., Oppenheimer, M., Rasmussen, D. J., Strauss, B. H. & Tebaldi, C. (2014). Probabilistic 21st and 22nd Century Sea-Level Projections at a Global Network of Tide-Gauge Sites. Earth’s Future, 2(8), 383–406.
  • Kulp, S. A. & Strauss, B. H. (2019). New Elevation Data Triple Estimates of Global Vulnerability to Sea-Level Rise and Coastal Flooding. Nature Communications, 10(1), 4844. Retrieved June 21, 2020, from http://www.nature.com/articles/s41467-019-12808-z
  • Muis, S., Verlaan, M., Winsemius, H. C., Aerts, J. C. J. H. & Ward, P. J. (2016). A Global Reanalysis of Storm Surges and Extreme Sea Levels. Nature Communications, 7.

Recent studies have stated the likely 1 to 2 meter global average sea level rise we could experience by 2100. On the Marshall islands, where a 91cm rise would make most of the island uninhabitable, a strategy must be decided on now.

Earth.Org has mapped what extreme flooding could look like by 2100 to illustrate the need for action.

—

The Marshall Islands, a string of atolls in the central Pacific Ocean, is among the countries most imminently threatened by unchecked climate change. The islands consist of 29 atolls with an average elevation of 2 metres, and sea levels are rising at twice the global average rate. By 2030, under a high emission scenario, sea level rise is projected to be in the range of 3 to 16cm; significantly increasing the frequency and the impact of storm surges and coastal flooding.

Researchers at the University of Hawaii produced some shocking sea level rise projections of Majuro, capital atoll of the Marshall Islands and the main international port of the nation. High-end sea level rise projections put the majority of its land area underwater by 2050, but the freshwater resources could become undrinkable well before then due to saltwater contamination. Everyday life on the islands is already made difficult by extreme weather events, which pushed more than 20,000 Marshallese climate refugees emigrated to the U.S. in 2016.

While short-term mitigation measures like sandbags or piecemeal barriers are used to help keep storm surges at bay, the need for a long-term solution grows with every centimeter of sea level rise. For the small island nation, stronger measures can come at a steep and prohibitive cost, leaving on relocation as a sad necessity.

Earth.Org has mapped the flooding these islands could face by the end of the century as a call for awareness. 

sea level rise by 2100 marshall islands

Sea level rise projections by 2100 on the Marshall Islands. Two scenarios are depicted with the amount of rise in meters indicated (mild = 2m; extreme = 4m). Percentage and total population displacement indicated bottom right.

Methodology

Global mean sea level is projected to rise by 2m at the end of this century. However, in order to determine local sea level rise (SLR), one has to take into account local coastal flood levels which could be 2.8m above Mean Higher-High Water (MHHW) at extreme forecasts. These local levels bring variability to the projected SLR from 1m to 6.5m (eg. Rio vs Kolkata).

The SLR scenarios used in this study are based on the forecasts from Climate Central – Coastal Risk Screening Tool  with the following parameters:

  • Sea level Projection Source
  • Coastal Flood Level
  • Pollution Scenario
  • Luck

Sea level Projection Source:

From two highly cited journals by Kopp et al., estimating SLR mainly due to ocean thermal expansion and ice melt. The mid-range scenario projected 0.5-1.2m of SLR based on different representative concentration pathways (RCP) defined by the IPCC. While the pessimistic scenario added more mechanisms of ice-sheet melting, estimating SLR at 1m-2.5m in 2100, with a projection of 10m SLR at 2300.

Coastal Flooding

More frequent coastal flooding is a direct impact of sea-level rise. Based on the Global tides and surge reanalysis by Muis et al., (2016), it is estimated that the extreme coastal water level could be from 0.2 – 2.8m over the mean level. While in extreme cases like China and the Netherlands it could experience 5-10m of extreme sea levels. Here, the coastal local flood level is added on top of the projected SLR.

Pollution Scenario:

Allows choosing the RCP, the greenhouse gas concentration trajectory defined by the IPCC.  The mild level is based on RCP4.5, of 2°C temperature rise; while the Extreme level is based on RCP 8.5, of 4°C temperature rise.

Luck:

Applies to the baseline SLR, defined in the “Sea level projection” section, upon which we add flooding. “Mild” refers to the mid-range scenario of 0.5-1.2m, and “extreme” to the pessimistic scenario of 1-2.5m. We used the high-end value of each scenario (mild = 1m; extreme = 2.5m).

Mapping by Braundt Lau. Article written by Wing Ki Leung and Owen Mulhern. 

You might also like: Sea Level Rise by 2100 – Miami

References:
  • Kulp, Scott A., and Benjamin H. Strauss. “New elevation data triple estimates of global vulnerability to sea-level rise and coastal flooding.” Nature communications 10.1 (2019): 1-12.
  • Florczyk, A. J., Corbane, C., Ehrlich, D., Freire, S., Kemper, T., Maffenini, L., Melchiorri, M., Politis, P., Schiavina, M., Sabo, F. & Zanchetta, L. (2019). GHSL Data Package 2019 Public Release.
  • Kopp, R. E., DeConto, R. M., Bader, D. A., Hay, C. C., Horton, R. M., Kulp, S., Oppenheimer, M., Pollard, D. & Strauss, B. H. (2017). Evolving Understanding of Antarctic Ice-Sheet Physics and Ambiguity in Probabilistic Sea-Level Projections. Earth’s Future, 5(12), 1217–1233.
  • Kopp, R. E., Horton, R. M., Little, C. M., Mitrovica, J. X., Oppenheimer, M., Rasmussen, D. J., Strauss, B. H. & Tebaldi, C. (2014). Probabilistic 21st and 22nd Century Sea-Level Projections at a Global Network of Tide-Gauge Sites. Earth’s Future, 2(8), 383–406.
  • Kulp, S. A. & Strauss, B. H. (2019). New Elevation Data Triple Estimates of Global Vulnerability to Sea-Level Rise and Coastal Flooding. Nature Communications, 10(1), 4844. Retrieved June 21, 2020, from http://www.nature.com/articles/s41467-019-12808-z
  • Muis, S., Verlaan, M., Winsemius, H. C., Aerts, J. C. J. H. & Ward, P. J. (2016). A Global Reanalysis of Storm Surges and Extreme Sea Levels. Nature Communications, 7.

The 33 islands of Kiribati are notoriously vulnerable to sea level rise; the highest point on many of the islands like South Tarawa is just a few meters above sea level. The impending threats of land loss, storm surge amplification, and permanent population displacement are becoming visible, and officials must decide on a strategy. 

Earth.Org has mapped what extreme flooding could look like by 2100 to illustrate the need for action.

—

Kiribati is an island nation in the central Pacific, which is expected to be the first country fully submerged by sea level rise. The islands are atolls and have a high ratio of coastline to land area. In 1989, a UN report on the greenhouse effect had listed the country as one of the countries at risk from rising sea levels. Ten years later, two of Kiribati’s uninhabited islands, Abanuea and Tebua Tarawa, disappeared under the waves.

Most of its 112,000 inhabitants live on the atoll of Tarawa, where the capital is located, sitting at less than 3 meters above sea level. The projected 1 to 2 meter global sea level rise by 2100 is quite likely to make it uninhabitable.  

The Kiribati government has bought land in Fiji to serve as a place to evacuate the country’s entire population should the worst case scenario come to pass. New Zealand’s government has also responded to the needs of Kiribatians, letting 75 people migrate to New Zealand per year.

We hope that international help will continue to come through for those whose homes could be lost to climate change. Earth.Org has mapped extreme flooding on Tarawa by 2100 to illustrate the very real consequences of climate change. 

sea level rise by 2100 kiribati

Sea level rise projections by 2100 for two scenarios with the amount of rise in meters indicated (mild = 1m; extreme = 3m). Percentage and total population displacement indicated bottom right.

Methodology

Global mean sea level is projected to rise by 2m at the end of this century. However, in order to determine local sea level rise (SLR), one has to take into account local coastal flood levels which could be 2.8m above Mean Higher-High Water (MHHW) at extreme forecasts. These local levels bring variability to the projected SLR from 1m to 6.5m (eg. Rio vs Kolkata).

The SLR scenarios used in this study are based on the forecasts from Climate Central – Coastal Risk Screening Tool  with the following parameters:

  • Sea level Projection Source
  • Coastal Flood Level
  • Pollution Scenario
  • Luck

Sea level Projection Source:

From two highly cited journals by Kopp et al., estimating SLR mainly due to ocean thermal expansion and ice melt. The mid-range scenario projected 0.5-1.2m of SLR based on different representative concentration pathways (RCP) defined by the IPCC. While the pessimistic scenario added more mechanisms of ice-sheet melting, estimating SLR at 1m-2.5m in 2100, with a projection of 10m SLR at 2300.

Coastal Flooding

More frequent coastal flooding is a direct impact of sea-level rise. Based on the Global tides and surge reanalysis by Muis et al., (2016), it is estimated that the extreme coastal water level could be from 0.2 – 2.8m over the mean level. While in extreme cases like China and the Netherlands it could experience 5-10m of extreme sea levels. Here, the coastal local flood level is added on top of the projected SLR.

Pollution Scenario:

Allows choosing the RCP, the greenhouse gas concentration trajectory defined by the IPCC.  The mild level is based on RCP4.5, of 2°C temperature rise; while the Extreme level is based on RCP 8.5, of 4°C temperature rise.

Luck:

Applies to the baseline SLR, defined in the “Sea level projection” section, upon which we add flooding. “Mild” refers to the mid-range scenario of 0.5-1.2m, and “extreme” to the pessimistic scenario of 1-2.5m. We used the high-end value of each scenario (mild = 1m; extreme = 2.5m).

Mapping by Braundt Lau. Article written by Wing Ki Leung and Owen Mulhern. 

You might also like: Sea Level Rise by 2100 – Miami


References:
  • Kulp, Scott A., and Benjamin H. Strauss. “New elevation data triple estimates of global vulnerability to sea-level rise and coastal flooding.” Nature communications 10.1 (2019): 1-12.
  • Florczyk, A. J., Corbane, C., Ehrlich, D., Freire, S., Kemper, T., Maffenini, L., Melchiorri, M., Politis, P., Schiavina, M., Sabo, F. & Zanchetta, L. (2019). GHSL Data Package 2019 Public Release.
  • Kopp, R. E., DeConto, R. M., Bader, D. A., Hay, C. C., Horton, R. M., Kulp, S., Oppenheimer, M., Pollard, D. & Strauss, B. H. (2017). Evolving Understanding of Antarctic Ice-Sheet Physics and Ambiguity in Probabilistic Sea-Level Projections. Earth’s Future, 5(12), 1217–1233.
  • Kopp, R. E., Horton, R. M., Little, C. M., Mitrovica, J. X., Oppenheimer, M., Rasmussen, D. J., Strauss, B. H. & Tebaldi, C. (2014). Probabilistic 21st and 22nd Century Sea-Level Projections at a Global Network of Tide-Gauge Sites. Earth’s Future, 2(8), 383–406.
  • Kulp, S. A. & Strauss, B. H. (2019). New Elevation Data Triple Estimates of Global Vulnerability to Sea-Level Rise and Coastal Flooding. Nature Communications, 10(1), 4844. Retrieved June 21, 2020, from http://www.nature.com/articles/s41467-019-12808-z
  • Muis, S., Verlaan, M., Winsemius, H. C., Aerts, J. C. J. H. & Ward, P. J. (2016). A Global Reanalysis of Storm Surges and Extreme Sea Levels. Nature Communications, 7.

Staring Boston right in the eye, sea level rise taunts the city to devise countermeasures against the continuously lapping water that have increased almost a foot since 1921 and will continue to rise to 1.5 feet by 2050. Considering many factors, cost-efficient but effective measures are taken as Boston braced themselves for more war against the sea.

Earth.Org has mapped the potential look of the floods Boston might have to fend off more often by 2100 with current sea level rise projections. 

—

Situated right by the shore, Boston is ranked as the 8th most vulnerable coastal city to flooding according to the Organization for Economic Cooperation and Development (OECD). Even without the occurrence of a storm, high tide on a usual day is enough to drench parts of the city. Thermal expansion of seawater and ice sheet melt are the driving factors behind sea level rise.  It has increased tidal flood frequency by nine events per year (compared to the 1970s), and could go up to 70 more per year by 2045. Aware of the danger this represents, the city has declared a city-wide redesigning of its shorefronts to minimize flood impact on day to day life. 

Large areas of the city will still be flood-prone, especially when considering the possibility of a 1-in-100 year storm surge (whose intensity has a 1% chance of occurring in any given year) on top of sea level rise. The question is then whether it is worth investing in costly adaptation or simply relocating communities. “You either protect people or you get them out of the way,” Michael Oppenheimer from Princeton University’s geosciences and international affairs said. “There just isn’t a choice”. The socio-economic disparity between some of the vulnerable areas will have to be carefully considered by officials when making this decision.

Adaptation is already underway: the main street in Charleston is raised by about two feet, watertight steel doors were erected at the rail tunnel entrance near Fenway Park and a 10 feet high flood protection berm is installed to serve as a reservoir beneath Joe Moakley Park, also boasting its height.

The cumulative damage and adaptation cost between the period of 2000 to 2100 for coastal flooding range from approximately US$6 billion to US$94 billion. Countries still hesitant to invest in mitigation measures would do well to follow Boston’s example. 

As a call for awareness, Earth.Org has mapped what extreme flooding would look like in Boston by 2100 if no action were taken.

sea level rise by 2100 boston

Sea level rise projections by 2100 for two scenarios with the amount of rise in meters indicated (mild = 2m; extreme = 4m). Percentage and total population displacement indicated bottom right.

Methodology

Global mean sea level is projected to rise by 2m at the end of this century. However, in order to determine local sea level rise (SLR), one has to take into account local coastal flood levels which could be 2.8m above Mean Higher-High Water (MHHW) at extreme forecasts. These local levels bring variability to the projected SLR from 1m to 6.5m (eg. Rio vs Kolkata).

The SLR scenarios used in this study are based on the forecasts from Climate Central – Coastal Risk Screening Tool  with the following parameters:

  • Sea level Projection Source
  • Coastal Flood Level
  • Pollution Scenario
  • Luck

Sea level Projection Source:

From two highly cited journals by Kopp et al., estimating SLR mainly due to ocean thermal expansion and ice melt. The mid-range scenario projected 0.5-1.2m of SLR based on different representative concentration pathways (RCP) defined by the IPCC. While the pessimistic scenario added more mechanisms of ice-sheet melting, estimating SLR at 1m-2.5m in 2100, with a projection of 10m SLR at 2300.

Coastal Flooding

More frequent coastal flooding is a direct impact of sea-level rise. Based on the Global tides and surge reanalysis by Muis et al., (2016), it is estimated that the extreme coastal water level could be from 0.2 – 2.8m over the mean level. While in extreme cases like China and the Netherlands it could experience 5-10m of extreme sea levels. Here, the coastal local flood level is added on top of the projected SLR.

Pollution Scenario:

Allows choosing the RCP, the greenhouse gas concentration trajectory defined by the IPCC.  The mild level is based on RCP4.5, of 2°C temperature rise; while the Extreme level is based on RCP 8.5, of 4°C temperature rise.

Luck:

Applies to the baseline SLR, defined in the “Sea level projection” section, upon which we add flooding. “Mild” refers to the mid-range scenario of 0.5-1.2m, and “extreme” to the pessimistic scenario of 1-2.5m. We used the high-end value of each scenario (mild = 1m; extreme = 2.5m).

Mapping by Braundt Lau. Article written by Eva Angela Seputra and Owen Mulhern. 

You might also like: Sea Level Rise by 2100 – Miami

References:
  • Kulp, Scott A., and Benjamin H. Strauss. “New elevation data triple estimates of global vulnerability to sea-level rise and coastal flooding.” Nature communications 10.1 (2019): 1-12.
  • Florczyk, A. J., Corbane, C., Ehrlich, D., Freire, S., Kemper, T., Maffenini, L., Melchiorri, M., Politis, P., Schiavina, M., Sabo, F. & Zanchetta, L. (2019). GHSL Data Package 2019 Public Release.
  • Kopp, R. E., DeConto, R. M., Bader, D. A., Hay, C. C., Horton, R. M., Kulp, S., Oppenheimer, M., Pollard, D. & Strauss, B. H. (2017). Evolving Understanding of Antarctic Ice-Sheet Physics and Ambiguity in Probabilistic Sea-Level Projections. Earth’s Future, 5(12), 1217–1233.
  • Kopp, R. E., Horton, R. M., Little, C. M., Mitrovica, J. X., Oppenheimer, M., Rasmussen, D. J., Strauss, B. H. & Tebaldi, C. (2014). Probabilistic 21st and 22nd Century Sea-Level Projections at a Global Network of Tide-Gauge Sites. Earth’s Future, 2(8), 383–406.
  • Kulp, S. A. & Strauss, B. H. (2019). New Elevation Data Triple Estimates of Global Vulnerability to Sea-Level Rise and Coastal Flooding. Nature Communications, 10(1), 4844. Retrieved June 21, 2020, from http://www.nature.com/articles/s41467-019-12808-z
  • Muis, S., Verlaan, M., Winsemius, H. C., Aerts, J. C. J. H. & Ward, P. J. (2016). A Global Reanalysis of Storm Surges and Extreme Sea Levels. Nature Communications, 7.

Subscribe to our newsletters

The best environmental stories of the week and month, handpicked by our Editor. Make sure you're on top of what's new in the climate.

SUBSCRIBE