Sign Up
Earth.Org Newsletters

Sign up to our weekly easy-to-digest recap of climate news from around the world.

Earth.Org PAST · PRESENT · FUTURE

Ningbo is one of the busiest ports in the world, located in the Zhejiang province of China on the East China sea. It is one of the major Chinese agglomerations that sea level rise will put at high risk of flooding.

Earth.Org has mapped severe inundation in Ningbo by 2100 to raise awareness. 

—

The Ningbo metropolitan area, comprising the city proper and three satellite cities, lies 270 km south of Shanghai on the Hangzhou Bay estuary. Ranked in the top ten global port cities since 2009, it has experienced rapid growth and its population, at 7.5 million today, is expected to reach 10 million by 2030. It also ranks in the top twenty most exposed ports to future coastal flooding due to sea level rise. 

Featuring a tropical climate with a pronounced typhoon and heavy rain season, Ningbo is familiar with costly floods. In 2005, Typhoon Kanu brought both an intense rainstorm and a powerful storm surge, incurring USD $585 million in losses. The number of people exposed to such flooding events is around 300,000 today, but population growth and sea level rise will increase this to a whopping 3.3 million by 2070. 

While studies have shown that better storm predictions could allow the city’s current infrastructure to better withstand storm surges, the 1 to 2 meter increase in global sea levels predicted by Climate Central’s 2019 study will likely overrun Ningbo’s defenses. 

Officials still have time to draft a long term plan, but cost will be high and execution time-consuming. Earth.Org has modelled extreme flooding in Ningbo by 2100 as a call to action.

sea level rise by 2100 ningbo

Sea level rise projections by 2100 for two scenarios with the amount of rise in meters indicated (mild = 2m; extreme = 4m). Population displacement indicated bottom right.

Methodology

Global mean sea level is projected to rise by 2m at the end of this century. However, in order to determine local sea level rise (SLR), one has to take into account local coastal flood levels which could be 2.8m above Mean Higher-High Water (MHHW) at extreme forecasts. These local levels bring variability to the projected SLR from 1m to 6.5m (eg. Rio vs Kolkata).

The SLR scenarios used in this study are based on the forecasts from Climate Central – Coastal Risk Screening Tool  with the following parameters:

  • Sea level Projection Source
  • Coastal Flood Level
  • Pollution Scenario
  • Luck

Sea level Projection Source

From two highly cited journals by Kopp et al., estimating SLR mainly due to ocean thermal expansion and ice melt. The mid-range scenario projected 0.5-1.2m of SLR based on different representative concentration pathways (RCP) defined by the IPCC. While the pessimistic scenario added more mechanisms of ice-sheet melting, estimating SLR at 1m-2.5m in 2100, with a projection of 10m SLR at 2300.

Coastal Flooding

More frequent coastal flooding is a direct impact of sea-level rise. Based on the Global tides and surge reanalysis by Muis et al., (2016), it is estimated that the extreme coastal water level could be from 0.2 – 2.8m over the mean level. While in extreme cases like China and the Netherlands it could experience 5-10m of extreme sea levels. Here, the coastal local flood level is added on top of the projected SLR.

Pollution Scenario

Allows choosing the RCP, the greenhouse gas concentration trajectory defined by the IPCC.  The mild level is based on RCP4.5, of 2°C temperature rise; while the Extreme level is based on RCP 8.5, of 4°C temperature rise.

Luck

Applies to the baseline SLR, defined in the “Sea level projection” section, upon which we add flooding. “Mild” refers to the mid-range scenario of 0.5-1.2m, and “extreme” to the pessimistic scenario of 1-2.5m. We used the high-end value of each scenario (mild = 1m; extreme = 2.5m).

Mapping and methodology by Braundt Lau.

You might also like: Sea Level Rise by 2100 – Antwerp

References:
  • Kulp, Scott A., and Benjamin H. Strauss. “New elevation data triple estimates of global vulnerability to sea-level rise and coastal flooding.” Nature communications 10.1 (2019): 1-12.
  • Florczyk, A. J., Corbane, C., Ehrlich, D., Freire, S., Kemper, T., Maffenini, L., Melchiorri, M., Politis, P., Schiavina, M., Sabo, F. & Zanchetta, L. (2019). GHSL Data Package 2019 Public Release.
  • Kopp, R. E., DeConto, R. M., Bader, D. A., Hay, C. C., Horton, R. M., Kulp, S., Oppenheimer, M., Pollard, D. & Strauss, B. H. (2017). Evolving Understanding of Antarctic Ice-Sheet Physics and Ambiguity in Probabilistic Sea-Level Projections. Earth’s Future, 5(12), 1217–1233.
  • Kopp, R. E., Horton, R. M., Little, C. M., Mitrovica, J. X., Oppenheimer, M., Rasmussen, D. J., Strauss, B. H. & Tebaldi, C. (2014). Probabilistic 21st and 22nd Century Sea-Level Projections at a Global Network of Tide-Gauge Sites. Earth’s Future, 2(8), 383–406.
  • Kulp, S. A. & Strauss, B. H. (2019). New Elevation Data Triple Estimates of Global Vulnerability to Sea-Level Rise and Coastal Flooding. Nature Communications, 10(1), 4844. Retrieved June 21, 2020, from http://www.nature.com/articles/s41467-019-12808-z
  • Muis, S., Verlaan, M., Winsemius, H. C., Aerts, J. C. J. H. & Ward, P. J. (2016). A Global Reanalysis of Storm Surges and Extreme Sea Levels. Nature Communications, 7.
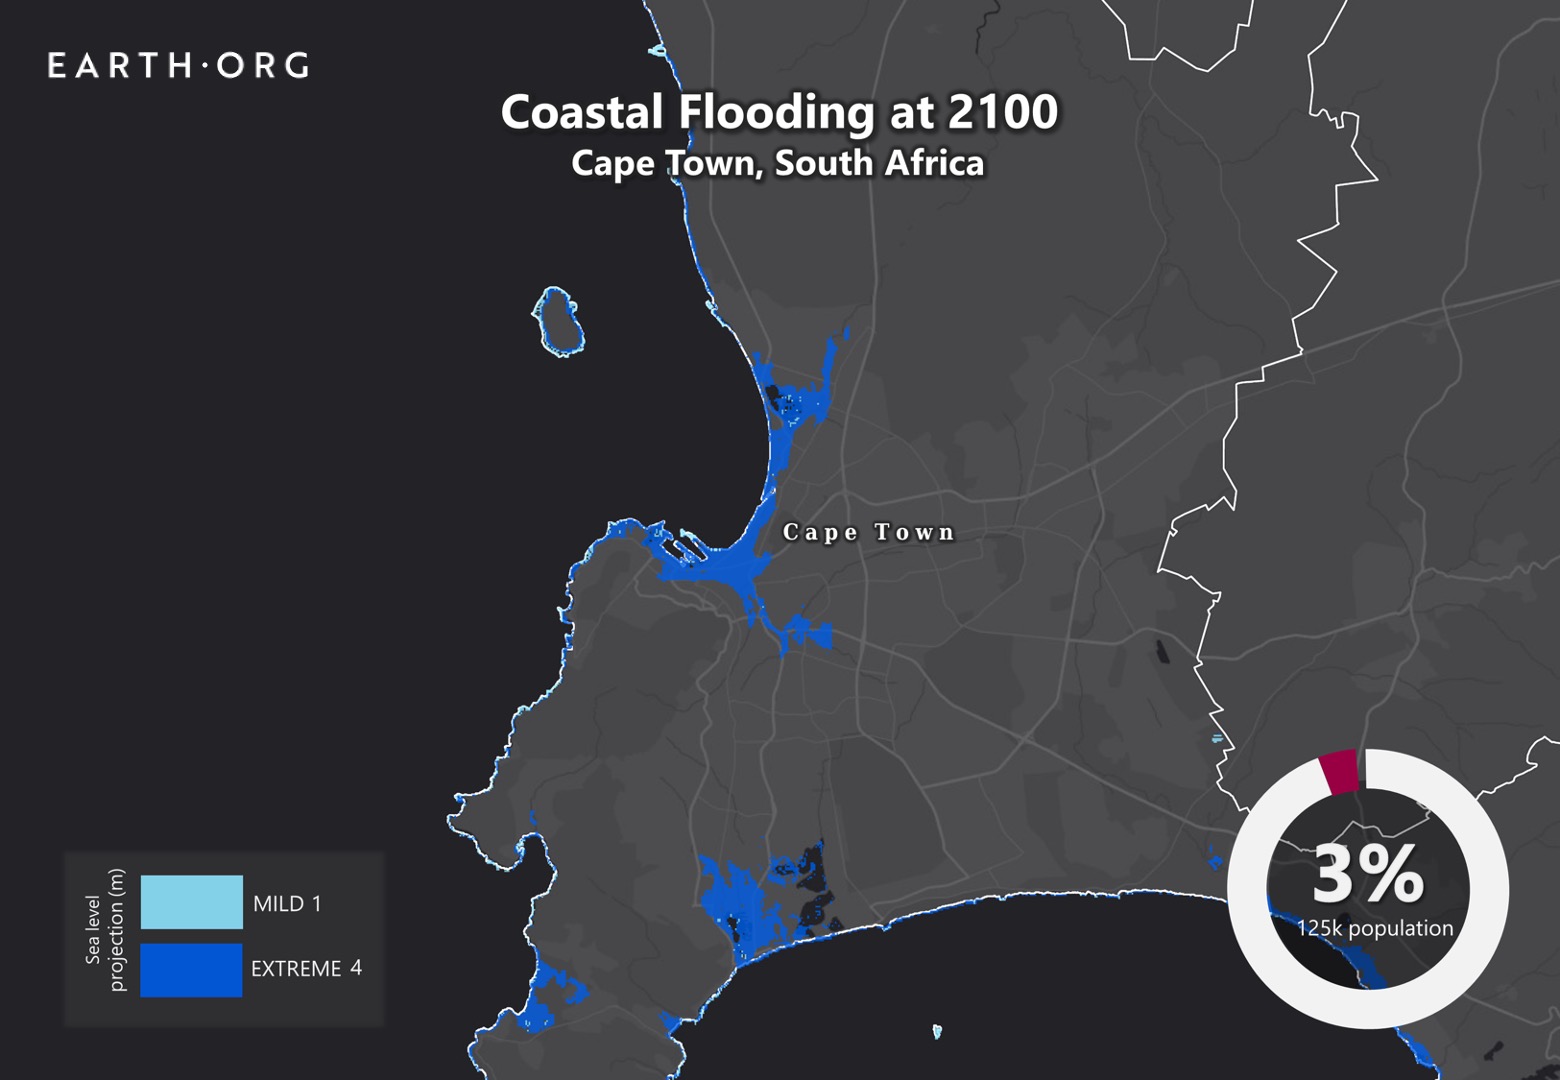
Despite the economic disparity between Cape Town’s world-famous coastline and its 437 informal settlements with more than 146,000 homes, both will be equally affected by sea level rise. Well aware of the risks, Cape Town officials weighing their options mitigate the damage. 

Earth.Org takes a closer look. 

—

The city of Cape Town is the legislative capital of South Africa, and the country’s second-most populous city after Johannesburg. Voted best place to visit in the world by both the New York Times and The Daily Telegraph, it has become an economic and cultural hub. The coveted coastline has attracted heavy investment and development, spreading inland as prices rise and availability dwindles. 

Urban expansion can have many flood risk-exacerbating factors. First, filling wetlands and canalizing rivers reduces the environment’s natural water storage capacity. Second, covering natural surfaces with impermeable materials increases water runoff towards topological reservoirs, like low-lying neighborhoods. Finally, uncontrolled expansion often leads to poorly designed drainage systems, typically in poorer neighborhoods where lower-income families bear the brunt of the consequences.  

A risk assessment was commissioned in 2008, concluding that sea level rise could incur USD $4.9 to $11 billion in damages to Cape Town over the next 25 years. Despite this, political gridlock makes it difficult to take action. As of today, the only strategy being considered is moving back from the coast, leaving a buffer zone for natural defenses to do the heavy lifting. We can only hope this will buy the city enough time to solve its political issues and draft a more comprehensive plan. 

Earth.Org has mapped what severe flooding could look like by 2100 as a call to action.

sea level rise by 2100 cape town

Sea level rise projections by 2100 for two scenarios with the amount of rise in meters indicated (mild = 1m; extreme = 4m). Percentage and total population displacement indicated bottom right.

Methodology

Global mean sea level is projected to rise by 2m at the end of this century. However, in order to determine local sea level rise (SLR), one has to take into account local coastal flood levels which could be 2.8m above Mean Higher-High Water (MHHW) at extreme forecasts. These local levels bring variability to the projected SLR from 1m to 6.5m (eg. Rio vs Kolkata).

The SLR scenarios used in this study are based on the forecasts from Climate Central – Coastal Risk Screening Tool  with the following parameters:

  • Sea level Projection Source
  • Coastal Flood Level
  • Pollution Scenario
  • Luck

Sea level Projection Source

From two highly cited journals by Kopp et al., estimating SLR mainly due to ocean thermal expansion and ice melt. The mid-range scenario projected 0.5-1.2m of SLR based on different representative concentration pathways (RCP) defined by the IPCC. While the pessimistic scenario added more mechanisms of ice-sheet melting, estimating SLR at 1m-2.5m in 2100, with a projection of 10m SLR at 2300.

Coastal Flooding

More frequent coastal flooding is a direct impact of sea-level rise. Based on the Global tides and surge reanalysis by Muis et al., (2016), it is estimated that the extreme coastal water level could be from 0.2 – 2.8m over the mean level. While in extreme cases like China and the Netherlands it could experience 5-10m of extreme sea levels. Here, the coastal local flood level is added on top of the projected SLR.

Pollution Scenario

Allows choosing the RCP, the greenhouse gas concentration trajectory defined by the IPCC.  The mild level is based on RCP4.5, of 2°C temperature rise; while the Extreme level is based on RCP 8.5, of 4°C temperature rise.

Luck:

Applies to the baseline SLR, defined in the “Sea level projection” section, upon which we add flooding. “Mild” refers to the mid-range scenario of 0.5-1.2m, and “extreme” to the pessimistic scenario of 1-2.5m. We used the high-end value of each scenario (mild = 1m; extreme = 2.5m).

Mapping and methodology by Braundt Lau.

You might also like: Sea Level Rise by the End of the Century – New York City

References:
  • Kulp, Scott A., and Benjamin H. Strauss. “New elevation data triple estimates of global vulnerability to sea-level rise and coastal flooding.” Nature communications 10.1 (2019): 1-12.
  • Florczyk, A. J., Corbane, C., Ehrlich, D., Freire, S., Kemper, T., Maffenini, L., Melchiorri, M., Politis, P., Schiavina, M., Sabo, F. & Zanchetta, L. (2019). GHSL Data Package 2019 Public Release.
  • Kopp, R. E., DeConto, R. M., Bader, D. A., Hay, C. C., Horton, R. M., Kulp, S., Oppenheimer, M., Pollard, D. & Strauss, B. H. (2017). Evolving Understanding of Antarctic Ice-Sheet Physics and Ambiguity in Probabilistic Sea-Level Projections. Earth’s Future, 5(12), 1217–1233.
  • Kopp, R. E., Horton, R. M., Little, C. M., Mitrovica, J. X., Oppenheimer, M., Rasmussen, D. J., Strauss, B. H. & Tebaldi, C. (2014). Probabilistic 21st and 22nd Century Sea-Level Projections at a Global Network of Tide-Gauge Sites. Earth’s Future, 2(8), 383–406.
  • Kulp, S. A. & Strauss, B. H. (2019). New Elevation Data Triple Estimates of Global Vulnerability to Sea-Level Rise and Coastal Flooding. Nature Communications, 10(1), 4844. Retrieved June 21, 2020, from http://www.nature.com/articles/s41467-019-12808-z
  • Muis, S., Verlaan, M., Winsemius, H. C., Aerts, J. C. J. H. & Ward, P. J. (2016). A Global Reanalysis of Storm Surges and Extreme Sea Levels. Nature Communications, 7.

Antwerp is another city that must prepare for the impact of sea level rise. Sitting on the Scheldt river estuary, it already features flood protection against North Sea tidal surges, but these won’t be sufficient to contain severe floods by the end of the century. 

Earth.Org has mapped what one of these floods could look like.

—

Built on the Seascheldt estuary, Antwerp is surrounded by a vast expanse of flatlands that regularly flood at high tide creating mudflats and salt marshes. 

When the city experienced disastrous floods in 1953 and 1976 it became clear that its inhabitants needed to build protection against storm surges. They dug a 512 km long dike as part of a strategy dubbed the Sigma plan, with deviation for the water to enter controlled flooding areas. 

Another component of this plan is a concrete wall around the city, 5.5 km long, and 1.35 meters high. Well aware of the rising sea levels, this barrier will be elevated by another 90 centimeters, but it also affects quality of life when the view of the sea is cut off. Mobile water barriers are also being considered, but the cost of construction and operation is higher. It may well be worth the cost if we do not curb global emissions soon.

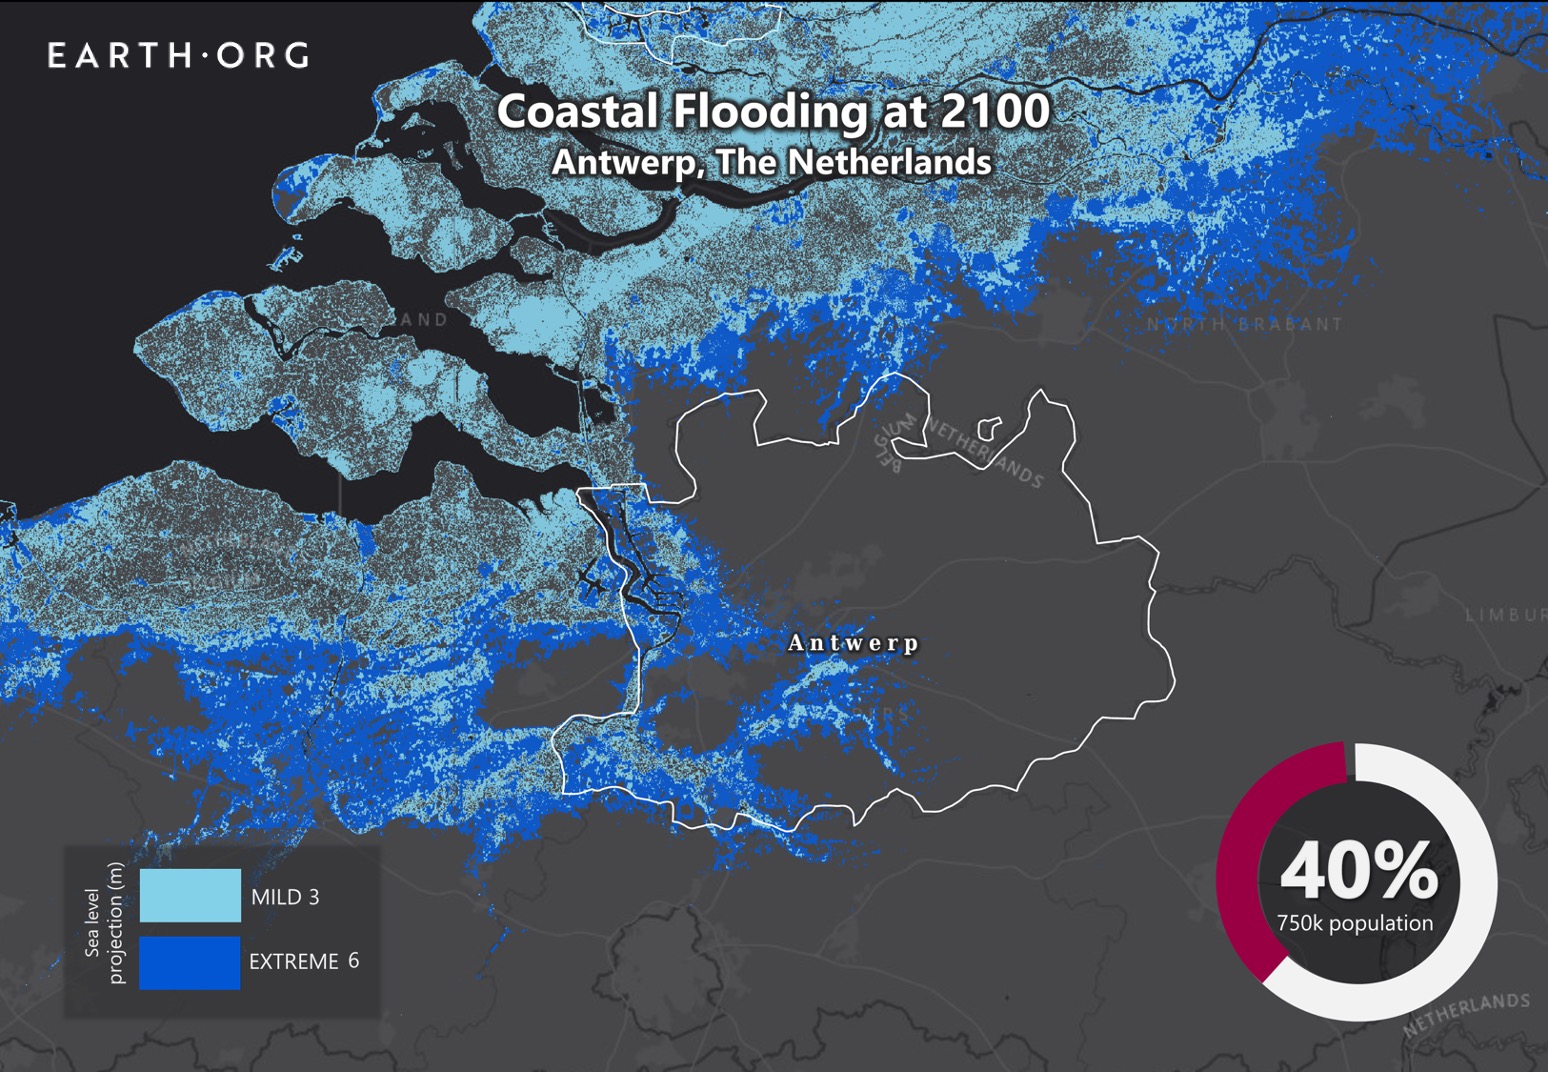
Earth.Org has mapped what extreme flooding could look like in Antwerp by 2100 to raise awareness of the risk. 

sea level rise by 2100 antwerp

Sea level rise projections by 2100 for two scenarios with the amount of rise in meters indicated (mild = 3m; extreme = 6m). Percentage and total population displacement indicated bottom right.

Methodology

Global mean sea level is projected to rise by 2m at the end of this century. However, in order to determine local sea level rise (SLR), one has to take into account local coastal flood levels which could be 2.8m above Mean Higher-High Water (MHHW) at extreme forecasts. These local levels bring variability to the projected SLR from 1m to 6.5m (eg. Rio vs Kolkata).

The SLR scenarios used in this study are based on the forecasts from Climate Central – Coastal Risk Screening Tool  with the following parameters:

  • Sea level Projection Source
  • Coastal Flood Level
  • Pollution Scenario
  • Luck

Sea level Projection Source

From two highly cited journals by Kopp et al., estimating SLR mainly due to ocean thermal expansion and ice melt. The mid-range scenario projected 0.5-1.2m of SLR based on different representative concentration pathways (RCP) defined by the IPCC. While the pessimistic scenario added more mechanisms of ice-sheet melting, estimating SLR at 1m-2.5m in 2100, with a projection of 10m SLR at 2300.

Coastal Flooding

More frequent coastal flooding is a direct impact of sea-level rise. Based on the Global tides and surge reanalysis by Muis et al., (2016), it is estimated that the extreme coastal water level could be from 0.2 – 2.8m over the mean level. While in extreme cases like China and the Netherlands it could experience 5-10m of extreme sea levels. Here, the coastal local flood level is added on top of the projected SLR.

Pollution Scenario

Allows choosing the RCP, the greenhouse gas concentration trajectory defined by the IPCC.  The mild level is based on RCP4.5, of 2°C temperature rise; while the Extreme level is based on RCP 8.5, of 4°C temperature rise.

Luck:

Applies to the baseline SLR, defined in the “Sea level projection” section, upon which we add flooding. “Mild” refers to the mid-range scenario of 0.5-1.2m, and “extreme” to the pessimistic scenario of 1-2.5m. We used the high-end value of each scenario (mild = 1m; extreme = 2.5m).

Mapping and methodology by Braundt Lau.

You might also like: Sea Level Rise by the End of the Century – New York City

References:
  • Kulp, Scott A., and Benjamin H. Strauss. “New elevation data triple estimates of global vulnerability to sea-level rise and coastal flooding.” Nature communications 10.1 (2019): 1-12.
  • Florczyk, A. J., Corbane, C., Ehrlich, D., Freire, S., Kemper, T., Maffenini, L., Melchiorri, M., Politis, P., Schiavina, M., Sabo, F. & Zanchetta, L. (2019). GHSL Data Package 2019 Public Release.
  • Kopp, R. E., DeConto, R. M., Bader, D. A., Hay, C. C., Horton, R. M., Kulp, S., Oppenheimer, M., Pollard, D. & Strauss, B. H. (2017). Evolving Understanding of Antarctic Ice-Sheet Physics and Ambiguity in Probabilistic Sea-Level Projections. Earth’s Future, 5(12), 1217–1233.
  • Kopp, R. E., Horton, R. M., Little, C. M., Mitrovica, J. X., Oppenheimer, M., Rasmussen, D. J., Strauss, B. H. & Tebaldi, C. (2014). Probabilistic 21st and 22nd Century Sea-Level Projections at a Global Network of Tide-Gauge Sites. Earth’s Future, 2(8), 383–406.
  • Kulp, S. A. & Strauss, B. H. (2019). New Elevation Data Triple Estimates of Global Vulnerability to Sea-Level Rise and Coastal Flooding. Nature Communications, 10(1), 4844. Retrieved June 21, 2020, from http://www.nature.com/articles/s41467-019-12808-z
  • Muis, S., Verlaan, M., Winsemius, H. C., Aerts, J. C. J. H. & Ward, P. J. (2016). A Global Reanalysis of Storm Surges and Extreme Sea Levels. Nature Communications, 7.

Sea level rise a different kind of dilemma for Hamburg, Germany. The city that was traumatized by the 1962 flood is now building infrastructures higher and higher. First dikes and now city plinths, how high would the Germans have to build to stay dry?

Earth.Org has mapped the high-level flood potential the low-lying city could suffer by 2100 with current sea level rise projections. 

—

Dikes and seawalls surrounding Hamburg have been elevated twice after two flooding episodes. The first was in 1962 when the North Sea flood caused the Elbe river to swell and occupy  ⅙ of Hamburg’s area. Then, in 2017, Hamburg’s famous fish market was flooded as storm Sabine caused the Elbe to rise by 2.76 meters. In reaction, the dikes have been raised from 5 meters to a varying height of 7.5 meters to 9.25 meters since they were first built.

Uniquely, apart from constructing shields, architects from Hamburg immersed themselves into an ambitious project called the Hafencity. Built on a small island and formally inaugurated in 2008, this neighborhood is an urban regeneration project, featuring many new hotels, shops and residential areas. A sophisticated flood control system was incorporated because dikes would cut off the view and be extremely expensive. Instead, all roads and public spaces were elevated on sand terraces over 7.5 meters high.  

hafencity hamburg

On the left side of this photo the new buildings with the plinth that can be flooded and on the right side the old warehouses of the harbor area © ELBE&FLUT, HafenCity Hamburg GmbH.

All shore-adjacent buildings must be water-proofed and provide access to the elevated areas in case of flooding. The HafenCity is considered the largest urban redevelopment project in Europe, at least in terms of landmass.

Meanwhile, the rest of Hamburg is counting on as a $592-million dike renovation project over the next 30 years to hold back alarming rates of sea level rises. Earth.Org has modeled the possible consequences of high tides in Hamburg by the end of the century.

sea level rise by 2100 hamburg

Sea level rise projections by 2100 for two scenarios with the amount of rise in meters indicated (mild = 2m; extreme = 3m). Percentage and total population displacement indicated bottom right.

Methodology

Global mean sea level is projected to rise by 2m at the end of this century. However, in order to determine local sea level rise (SLR), one has to take into account local coastal flood levels which could be 2.8m above Mean Higher-High Water (MHHW) at extreme forecasts. These local levels bring variability to the projected SLR from 1m to 6.5m (eg. Rio vs Kolkata).

The SLR scenarios used in this study are based on the forecasts from Climate Central – Coastal Risk Screening Tool  with the following parameters:

  • Sea level Projection Source
  • Coastal Flood Level
  • Pollution Scenario
  • Luck

Sea level Projection Source

From two highly cited journals by Kopp et al., estimating SLR mainly due to ocean thermal expansion and ice melt. The mid-range scenario projected 0.5-1.2m of SLR based on different representative concentration pathways (RCP) defined by the IPCC. While the pessimistic scenario added more mechanisms of ice-sheet melting, estimating SLR at 1m-2.5m in 2100, with a projection of 10m SLR at 2300.

Coastal Flooding

More frequent coastal flooding is a direct impact of sea-level rise. Based on the Global tides and surge reanalysis by Muis et al., (2016), it is estimated that the extreme coastal water level could be from 0.2 – 2.8m over the mean level. While in extreme cases like China and the Netherlands it could experience 5-10m of extreme sea levels. Here, the coastal local flood level is added on top of the projected SLR.

Pollution Scenario

Allows choosing the RCP, the greenhouse gas concentration trajectory defined by the IPCC.  The mild level is based on RCP4.5, of 2°C temperature rise; while the Extreme level is based on RCP 8.5, of 4°C temperature rise.

Luck

Applies to the baseline SLR, defined in the “Sea level projection” section, upon which we add flooding. “Mild” refers to the mid-range scenario of 0.5-1.2m, and “extreme” to the pessimistic scenario of 1-2.5m. We used the high-end value of each scenario (mild = 1m; extreme = 2.5m).

You might also like: Sea Level Rise by the End of the Century – New York City

This article was written by Eva Angela Seputra and Owen Mulhern. 

References:
  • Kulp, Scott A., and Benjamin H. Strauss. “New elevation data triple estimates of global vulnerability to sea-level rise and coastal flooding.” Nature communications 10.1 (2019): 1-12.
  • Florczyk, A. J., Corbane, C., Ehrlich, D., Freire, S., Kemper, T., Maffenini, L., Melchiorri, M., Politis, P., Schiavina, M., Sabo, F. & Zanchetta, L. (2019). GHSL Data Package 2019 Public Release.
  • Kopp, R. E., DeConto, R. M., Bader, D. A., Hay, C. C., Horton, R. M., Kulp, S., Oppenheimer, M., Pollard, D. & Strauss, B. H. (2017). Evolving Understanding of Antarctic Ice-Sheet Physics and Ambiguity in Probabilistic Sea-Level Projections. Earth’s Future, 5(12), 1217–1233.
  • Kopp, R. E., Horton, R. M., Little, C. M., Mitrovica, J. X., Oppenheimer, M., Rasmussen, D. J., Strauss, B. H. & Tebaldi, C. (2014). Probabilistic 21st and 22nd Century Sea-Level Projections at a Global Network of Tide-Gauge Sites. Earth’s Future, 2(8), 383–406.
  • Kulp, S. A. & Strauss, B. H. (2019). New Elevation Data Triple Estimates of Global Vulnerability to Sea-Level Rise and Coastal Flooding. Nature Communications, 10(1), 4844. Retrieved June 21, 2020, from http://www.nature.com/articles/s41467-019-12808-z
  • Muis, S., Verlaan, M., Winsemius, H. C., Aerts, J. C. J. H. & Ward, P. J. (2016). A Global Reanalysis of Storm Surges and Extreme Sea Levels. Nature Communications, 7.

Sea level rise is a serious matter for Buenos Aires. Vulnerable communities’ socioeconomic status is tied to the floods. By 2025 population growth in the coastal areas of Buenos Aires is expected to reach up to half a million people, all of whom could face relocation if no preventive action is taken. 

Earth.Org has mapped the extreme flooding Buenos Aires could experience by 2100.

—

Argentina’s capital city, Buenos Aires – as it is named, prized themselves on the “good air” or “good winds” that aid sailors around the port. Yet, as climate change continues to become an issue, hard blowing Sudestadas (the southeastern wind) might prompt stronger hits on the coasts.

Urbanization in Buenos Aires has taken a toll more than it has created a futuristic outlook. The region that is located on the southeastern coast of South America used to be crossed by various streams. Due to recurring, damaging floods, efforts were made in 1919 to dam most of those streams, minimizing the chance of flooding. Since then, large urbanization projects have reclaimed wide parcels of wetlands and heavily reduced groundwater absorption, leading to heavier floods downstream. These mainly affect low-income communities with poor drainage systems. 

Recognizing the many citizens at risk from this poor urban planning, Buenos Aires laid out a plan in 2005 to create large reservoirs surrounding flood-prone riverbeds and prevent rapid overflow. Funding from the World Bank was received in 2016 and the project aims for completion by 2022.

Unfortunately, these measures are geared toward the current level of flooding, but this is set to increase massively by the end of the century. The government is well aware, but have not drafted a long-term plan as of yet. Earth.Org has modelled sea level rise by 2100 as a reminder to act before it is too late.

sea level rise by 2100 buenos aires

Sea level rise projections by 2100 for two scenarios with the amount of rise in meters indicated (mild = 2m; extreme = 4m). Percentage and total population displacement indicated bottom right.

Methodology

Global mean sea level is projected to rise by 2m at the end of this century. However, in order to determine local sea level rise (SLR), one has to take into account local coastal flood levels which could be 2.8m above Mean Higher-High Water (MHHW) at extreme forecasts. These local levels bring variability to the projected SLR from 1m to 6.5m (eg. Rio vs Kolkata).

The SLR scenarios used in this study are based on the forecasts from Climate Central – Coastal Risk Screening Tool  with the following parameters:

  • Sea level Projection Source
  • Coastal Flood Level
  • Pollution Scenario
  • Luck

Sea level Projection Source:

From two highly cited journals by Kopp et al., estimating SLR mainly due to ocean thermal expansion and ice melt. The mid-range scenario projected 0.5-1.2m of SLR based on different representative concentration pathways (RCP) defined by the IPCC. While the pessimistic scenario added more mechanisms of ice-sheet melting, estimating SLR at 1m-2.5m in 2100, with a projection of 10m SLR at 2300.

Coastal Flooding

More frequent coastal flooding is a direct impact of sea-level rise. Based on the Global tides and surge reanalysis by Muis et al., (2016), it is estimated that the extreme coastal water level could be from 0.2 – 2.8m over the mean level. While in extreme cases like China and the Netherlands it could experience 5-10m of extreme sea levels. Here, the coastal local flood level is added on top of the projected SLR.

Pollution Scenario:

Allows choosing the RCP, the greenhouse gas concentration trajectory defined by the IPCC.  The mild level is based on RCP4.5, of 2°C temperature rise; while the Extreme level is based on RCP 8.5, of 4°C temperature rise.

Luck:

Applies to the baseline SLR, defined in the “Sea level projection” section, upon which we add flooding. “Mild” refers to the mid-range scenario of 0.5-1.2m, and “extreme” to the pessimistic scenario of 1-2.5m. We used the high-end value of each scenario (mild = 1m; extreme = 2.5m).

You might also like: Sea Level Rise by the End of the Century – New York City

This article was written by Eva Angela Seputra and Owen Mulhern. 

References:
  • Kulp, Scott A., and Benjamin H. Strauss. “New elevation data triple estimates of global vulnerability to sea-level rise and coastal flooding.” Nature communications 10.1 (2019): 1-12.
  • Florczyk, A. J., Corbane, C., Ehrlich, D., Freire, S., Kemper, T., Maffenini, L., Melchiorri, M., Politis, P., Schiavina, M., Sabo, F. & Zanchetta, L. (2019). GHSL Data Package 2019 Public Release.
  • Kopp, R. E., DeConto, R. M., Bader, D. A., Hay, C. C., Horton, R. M., Kulp, S., Oppenheimer, M., Pollard, D. & Strauss, B. H. (2017). Evolving Understanding of Antarctic Ice-Sheet Physics and Ambiguity in Probabilistic Sea-Level Projections. Earth’s Future, 5(12), 1217–1233.
  • Kopp, R. E., Horton, R. M., Little, C. M., Mitrovica, J. X., Oppenheimer, M., Rasmussen, D. J., Strauss, B. H. & Tebaldi, C. (2014). Probabilistic 21st and 22nd Century Sea-Level Projections at a Global Network of Tide-Gauge Sites. Earth’s Future, 2(8), 383–406.
  • Kulp, S. A. & Strauss, B. H. (2019). New Elevation Data Triple Estimates of Global Vulnerability to Sea-Level Rise and Coastal Flooding. Nature Communications, 10(1), 4844. Retrieved June 21, 2020, from http://www.nature.com/articles/s41467-019-12808-z
  • Muis, S., Verlaan, M., Winsemius, H. C., Aerts, J. C. J. H. & Ward, P. J. (2016). A Global Reanalysis of Storm Surges and Extreme Sea Levels. Nature Communications, 7.

Rotterdam in the Netherlands is known to be at risk of being submerged due to sea level rise. Standing 20 feet below this threshold, the city has implemented innovative measures to live with Mother Nature instead of fighting it. Their best flood mitigation procedure is increasing the capacity of their whole city to capture water.

Earth.Org has mapped the high-level flood potential the low-lying city could suffer by 2100 with current sea level rise projections. 

—

The Netherlands is well-known for being the leading country when it comes to battling floods. Danger is always lurking for provinces like Rotterdam that is located at the mouth of Nieuwe Maas channel leading towards the North Sea. Their biggest protection is The Maeslantkering, the Rotterdam dam that closes once storm surges exceed 3 meters height. 

maeslantkering rotterdam

By John Englander February 11, 2019.

The Maeslantkering itself has only had to close twice in 22 years. Projected frequencies of storm surges might force it to close once annually in the near future. Despite that, Rotterdam refuses to “keep building higher levees, because we will end up living behind 10-meter walls,” said Harold van Waveren, a senior government adviser. Instead, the Dutch have opted to give Room for the River. Letting water in and live with it.

Infrastructures all across the province have the added function of water storage to help mitigate flooding. Parking garages are transformed into emergency reservoirs, and open plazas are designed to fill up, with drainage systems that redirect water back to the river. Concrete pavement in gardens around neighborhoods have been removed to increase water absorption capacity, and crops are also carefully selected and modified to adapt with saline water.

Besides storm surges, Rotterdam often gets an abundance of rain showers. Excess downpour is controlled by rooftop farms holding up to 60 liters of water per square meter. Built-in Smart Roofs monitor rain forecasts and adjust their flow.  

Despite the cutting edge strategies employed in Rotterdam, these will not be enough to contain the projected 1 to 2 meter rise in sea levels by 2100. However, it may buy them enough time to come up with another solution, such as relocation. Earth.Org has modeled what extreme flooding could look like in Rotterdam by 2100 to help you visualize the impending threat.

sea level rise by 2100 rotterdam

Sea level rise projections by 2100 for two scenarios with the amount of rise in meters indicated (mild = 3m; extreme = 6m). Percentage and total population displacement indicated bottom right.

Methodology

Global mean sea level is projected to rise by 2m at the end of this century. However, in order to determine local sea level rise (SLR), one has to take into account local coastal flood levels which could be 2.8m above Mean Higher-High Water (MHHW) at extreme forecasts. These local levels bring variability to the projected SLR from 1m to 6.5m (eg. Rio vs Kolkata).

The SLR scenarios used in this study are based on the forecasts from Climate Central – Coastal Risk Screening Tool  with the following parameters:

  • Sea level Projection Source
  • Coastal Flood Level
  • Pollution Scenario
  • Luck

Sea level Projection Source:

From two highly cited journals by Kopp et al., estimating SLR mainly due to ocean thermal expansion and ice melt. The mid-range scenario projected 0.5-1.2m of SLR based on different representative concentration pathways (RCP) defined by the IPCC. While the pessimistic scenario added more mechanisms of ice-sheet melting, estimating SLR at 1m-2.5m in 2100, with a projection of 10m SLR at 2300.

Coastal Flooding

More frequent coastal flooding is a direct impact of sea-level rise. Based on the Global tides and surge reanalysis by Muis et al., (2016), it is estimated that the extreme coastal water level could be from 0.2 – 2.8m over the mean level. While in extreme cases like China and the Netherlands it could experience 5-10m of extreme sea levels. Here, the coastal local flood level is added on top of the projected SLR.

Pollution Scenario:

Allows choosing the RCP, the greenhouse gas concentration trajectory defined by the IPCC.  The mild level is based on RCP4.5, of 2°C temperature rise; while the Extreme level is based on RCP 8.5, of 4°C temperature rise.

Luck:

Applies to the baseline SLR, defined in the “Sea level projection” section, upon which we add flooding. “Mild” refers to the mid-range scenario of 0.5-1.2m, and “extreme” to the pessimistic scenario of 1-2.5m. We used the high-end value of each scenario (mild = 1m; extreme = 2.5m).

You might also like: Sea Level Rise by the End of the Century – New York City

This article was written by Eva Angela Seputra and Owen Mulhern. 

References:
  • Kulp, Scott A., and Benjamin H. Strauss. “New elevation data triple estimates of global vulnerability to sea-level rise and coastal flooding.” Nature communications 10.1 (2019): 1-12.
  • Florczyk, A. J., Corbane, C., Ehrlich, D., Freire, S., Kemper, T., Maffenini, L., Melchiorri, M., Politis, P., Schiavina, M., Sabo, F. & Zanchetta, L. (2019). GHSL Data Package 2019 Public Release.
  • Kopp, R. E., DeConto, R. M., Bader, D. A., Hay, C. C., Horton, R. M., Kulp, S., Oppenheimer, M., Pollard, D. & Strauss, B. H. (2017). Evolving Understanding of Antarctic Ice-Sheet Physics and Ambiguity in Probabilistic Sea-Level Projections. Earth’s Future, 5(12), 1217–1233.
  • Kopp, R. E., Horton, R. M., Little, C. M., Mitrovica, J. X., Oppenheimer, M., Rasmussen, D. J., Strauss, B. H. & Tebaldi, C. (2014). Probabilistic 21st and 22nd Century Sea-Level Projections at a Global Network of Tide-Gauge Sites. Earth’s Future, 2(8), 383–406.
  • Kulp, S. A. & Strauss, B. H. (2019). New Elevation Data Triple Estimates of Global Vulnerability to Sea-Level Rise and Coastal Flooding. Nature Communications, 10(1), 4844. Retrieved June 21, 2020, from http://www.nature.com/articles/s41467-019-12808-z
  • Muis, S., Verlaan, M., Winsemius, H. C., Aerts, J. C. J. H. & Ward, P. J. (2016). A Global Reanalysis of Storm Surges and Extreme Sea Levels. Nature Communications, 7.

Home to more than 4 million people, Chittagong is highly vulnerable to flooding from tidal surges, the North Indian Ocean tropical cyclones and monsoonal rains. Sea level rise and rapid coastal erosion are set to exacerbate these problems and possibly drive one of the first mass climate refugee migrations in the world. 

Earth.Org has mapped what extreme flooding could look like in Chittagong by 2100. 

—

Chittagong is known as the biggest port city and financial center of Bangladesh. It is built in a hilly area around the Karnaphuli River, which runs through the city center and pours into the Bay of Bengal through an estuary located 12km west of Chittagong. Its population routinely faces floods during coastal tide surges, putting entire neighborhoods into gridlock and forcing individuals to fend for themselves. But try as they may to barricade entrances and elevate their floors, the flooding always wins.

The less mundane form of this plague comes with heavy rains that cause deadly landslides and flash floods. As it is, the conditions are barely liveable, and there could be a 30cm sea level rise in as little as 20 years. 

Plans for flood control have been announced, but a lack of transparency and visible action leaves citizens doubtful. If no flood control is implemented, citizens of Chittagong another 11 million people in Bangladesh will be displaced permanently by 2050. This could rise to 27 million by 2100. Left with no choice, the Bangladeshi could begin the first mass climate refugee movement on Earth, and their neighbors in India and Myanmar are unlikely to welcome them with open arms. 

Earth.Org has mapped what extreme flooding could look like in Chittagong by 2100 to illustrate the need for action.

sea level rise by 2100 chittagong

Sea level rise projections by 2100 for two scenarios with the amount of rise in meters indicated (mild = 3m; extreme = 5m). Percentage and total population displacement indicated bottom right.

Methodology

Global mean sea level is projected to rise by 2m at the end of this century. However, in order to determine local sea level rise (SLR), one has to take into account local coastal flood levels which could be 2.8m above Mean Higher-High Water (MHHW) at extreme forecasts. These local levels bring variability to the projected SLR from 1m to 6.5m (eg. Rio vs Kolkata).

The SLR scenarios used in this study are based on the forecasts from Climate Central – Coastal Risk Screening Tool  with the following parameters:

  • Sea level Projection Source
  • Coastal Flood Level
  • Pollution Scenario
  • Luck

Sea level Projection Source:

From two highly cited journals by Kopp et al., estimating SLR mainly due to ocean thermal expansion and ice melt. The mid-range scenario projected 0.5-1.2m of SLR based on different representative concentration pathways (RCP) defined by the IPCC. While the pessimistic scenario added more mechanisms of ice-sheet melting, estimating SLR at 1m-2.5m in 2100, with a projection of 10m SLR at 2300.

Coastal Flooding

More frequent coastal flooding is a direct impact of sea-level rise. Based on the Global tides and surge reanalysis by Muis et al., (2016), it is estimated that the extreme coastal water level could be from 0.2 – 2.8m over the mean level. While in extreme cases like China and the Netherlands it could experience 5-10m of extreme sea levels. Here, the coastal local flood level is added on top of the projected SLR.

Pollution Scenario:

Allows choosing the RCP, the greenhouse gas concentration trajectory defined by the IPCC.  The mild level is based on RCP4.5, of 2°C temperature rise; while the Extreme level is based on RCP 8.5, of 4°C temperature rise.

Luck:

Applies to the baseline SLR, defined in the “Sea level projection” section, upon which we add flooding. “Mild” refers to the mid-range scenario of 0.5-1.2m, and “extreme” to the pessimistic scenario of 1-2.5m. We used the high-end value of each scenario (mild = 1m; extreme = 2.5m).

You might also like: Sea Level Rise by the End of the Century – New York City

References:
  • Kulp, Scott A., and Benjamin H. Strauss. “New elevation data triple estimates of global vulnerability to sea-level rise and coastal flooding.” Nature communications 10.1 (2019): 1-12.
  • Florczyk, A. J., Corbane, C., Ehrlich, D., Freire, S., Kemper, T., Maffenini, L., Melchiorri, M., Politis, P., Schiavina, M., Sabo, F. & Zanchetta, L. (2019). GHSL Data Package 2019 Public Release.
  • Kopp, R. E., DeConto, R. M., Bader, D. A., Hay, C. C., Horton, R. M., Kulp, S., Oppenheimer, M., Pollard, D. & Strauss, B. H. (2017). Evolving Understanding of Antarctic Ice-Sheet Physics and Ambiguity in Probabilistic Sea-Level Projections. Earth’s Future, 5(12), 1217–1233.
  • Kopp, R. E., Horton, R. M., Little, C. M., Mitrovica, J. X., Oppenheimer, M., Rasmussen, D. J., Strauss, B. H. & Tebaldi, C. (2014). Probabilistic 21st and 22nd Century Sea-Level Projections at a Global Network of Tide-Gauge Sites. Earth’s Future, 2(8), 383–406.
  • Kulp, S. A. & Strauss, B. H. (2019). New Elevation Data Triple Estimates of Global Vulnerability to Sea-Level Rise and Coastal Flooding. Nature Communications, 10(1), 4844. Retrieved June 21, 2020, from http://www.nature.com/articles/s41467-019-12808-z
  • Muis, S., Verlaan, M., Winsemius, H. C., Aerts, J. C. J. H. & Ward, P. J. (2016). A Global Reanalysis of Storm Surges and Extreme Sea Levels. Nature Communications, 7.

Most of Honolulu’s population, infrastructure, and economic activity is concentrated on the Diamond Head to Pearl Harbor coastal area. This low-lying, densely populated area is at high risk of being submerged by sea level rise. 

Earth.Org has mapped what severe coastal flooding could look like in Honolulu by the end of the century.

—

The 400,000 inhabitants of Honolulu are exposed to flash floods from torrential rain, hurricanes, and tsunamis. Natural tides, which can have amplitudes of up to ten feet in some areas, also cause inundations. The coincidence of high tides and extreme weather events is thankfully rare, but nonetheless devastating as demonstrated by a 1959 hurricane that caused USD $1.8billion in damage. 

Sea level rise is of major concern in Honolulu, as saltwater will contaminate freshwater resources, and the heightened water table will hamper drainage, increasing flood-proneness from lesser events. Seasonal high tides, hurricanes and tsunamis will be able to penetrate further inland, creating sewage overflow and infrastructure damage. 

It is essential for local authorities to first recognize the threat of sea level rise, as they have not yet shown proper consideration of the risks. They can then begin to implement policies and infrastructure for mitigation, such as building elevation. The most difficult but necessary step will be defining the “off-limit zones”, sure to be submerged. The government will need to purchase these zones and relocate communities within them to safer locations. There are many other strategies, and it is up to Hawai’ian officials to propose and execute a plan before it is too late.

Earth.Org has mapped a severe flooding scenario in Honolulu by 2100 if no action is taken. 

sea level rise by 2100 honolulu

Sea level rise projections by 2100 for two scenarios with the amount of rise in meters indicated (mild = 1m; extreme = 3m). Percentage and total population displacement indicated bottom right.

Methodology

Global mean sea level is projected to rise by 2m at the end of this century. However, in order to determine local sea level rise (SLR), one has to take into account local coastal flood levels which could be 2.8m above Mean Higher-High Water (MHHW) at extreme forecasts. These local levels bring variability to the projected SLR from 1m to 6.5m (eg. Rio vs Kolkata).

The SLR scenarios used in this study are based on the forecasts from Climate Central – Coastal Risk Screening Tool  with the following parameters:

  • Sea level Projection Source
  • Coastal Flood Level
  • Pollution Scenario
  • Luck

Sea level Projection Source:

From two highly cited journals by Kopp et al., estimating SLR mainly due to ocean thermal expansion and ice melt. The mid-range scenario projected 0.5-1.2m of SLR based on different representative concentration pathways (RCP) defined by the IPCC. While the pessimistic scenario added more mechanisms of ice-sheet melting, estimating SLR at 1m-2.5m in 2100, with a projection of 10m SLR at 2300.

Coastal Flooding

More frequent coastal flooding is a direct impact of sea-level rise. Based on the Global tides and surge reanalysis by Muis et al., (2016), it is estimated that the extreme coastal water level could be from 0.2 – 2.8m over the mean level. While in extreme cases like China and the Netherlands it could experience 5-10m of extreme sea levels. Here, the coastal local flood level is added on top of the projected SLR.

Pollution Scenario:

Allows choosing the RCP, the greenhouse gas concentration trajectory defined by the IPCC.  The mild level is based on RCP4.5, of 2°C temperature rise; while the Extreme level is based on RCP 8.5, of 4°C temperature rise.

Luck:

Applies to the baseline SLR, defined in the “Sea level projection” section, upon which we add flooding. “Mild” refers to the mid-range scenario of 0.5-1.2m, and “extreme” to the pessimistic scenario of 1-2.5m. We used the high-end value of each scenario (mild = 1m; extreme = 2.5m).

You might also like: Sea Level Rise by the End of the Century – New York City

References:
  • Kulp, Scott A., and Benjamin H. Strauss. “New elevation data triple estimates of global vulnerability to sea-level rise and coastal flooding.” Nature communications 10.1 (2019): 1-12.
  • Florczyk, A. J., Corbane, C., Ehrlich, D., Freire, S., Kemper, T., Maffenini, L., Melchiorri, M., Politis, P., Schiavina, M., Sabo, F. & Zanchetta, L. (2019). GHSL Data Package 2019 Public Release.
  • Kopp, R. E., DeConto, R. M., Bader, D. A., Hay, C. C., Horton, R. M., Kulp, S., Oppenheimer, M., Pollard, D. & Strauss, B. H. (2017). Evolving Understanding of Antarctic Ice-Sheet Physics and Ambiguity in Probabilistic Sea-Level Projections. Earth’s Future, 5(12), 1217–1233.
  • Kopp, R. E., Horton, R. M., Little, C. M., Mitrovica, J. X., Oppenheimer, M., Rasmussen, D. J., Strauss, B. H. & Tebaldi, C. (2014). Probabilistic 21st and 22nd Century Sea-Level Projections at a Global Network of Tide-Gauge Sites. Earth’s Future, 2(8), 383–406.
  • Kulp, S. A. & Strauss, B. H. (2019). New Elevation Data Triple Estimates of Global Vulnerability to Sea-Level Rise and Coastal Flooding. Nature Communications, 10(1), 4844. Retrieved June 21, 2020, from http://www.nature.com/articles/s41467-019-12808-z
  • Muis, S., Verlaan, M., Winsemius, H. C., Aerts, J. C. J. H. & Ward, P. J. (2016). A Global Reanalysis of Storm Surges and Extreme Sea Levels. Nature Communications, 7.

Many districts in Dakar, the capital of Senegal, are flooded for weeks every year during the rainy season. Aside from damaging roads and homes, water surges also promote mosquito proliferation and contaminate drinking water with disease. Sea level rise is expected to increase the likelihood of severe flooding, and officials need a plan if they are to avoid quality of life and economic loss.

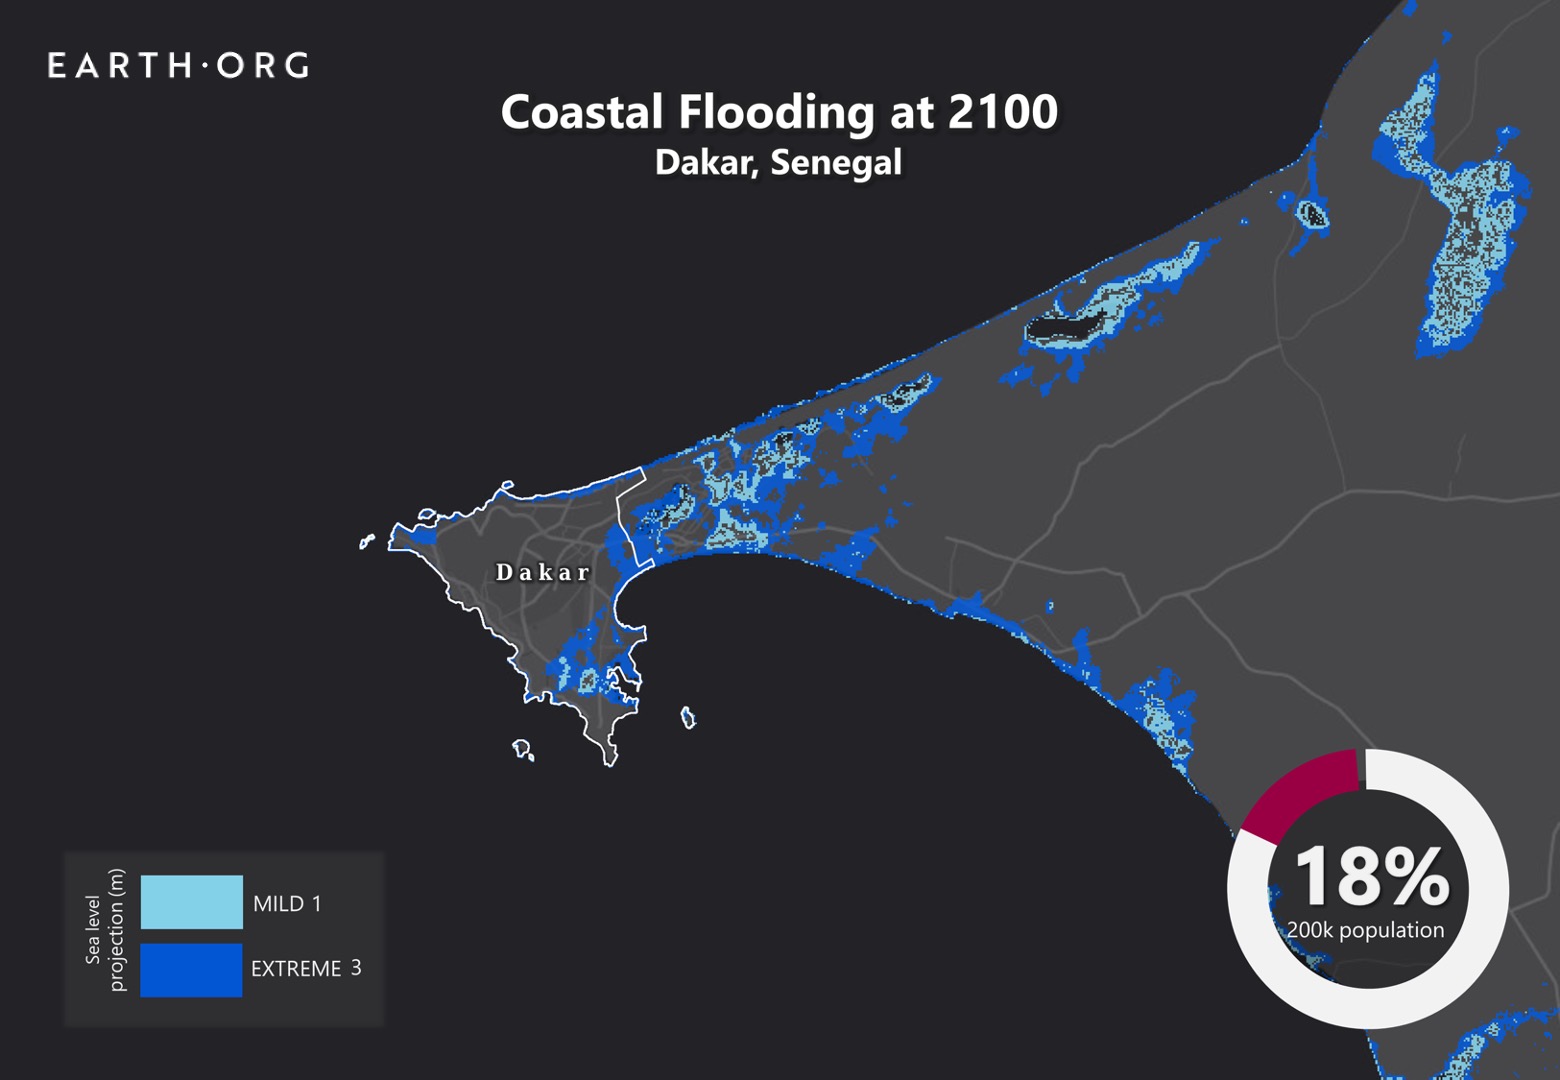
Earth.org has mapped extreme flooding in Dakar by 2100 as a call to action. 

—

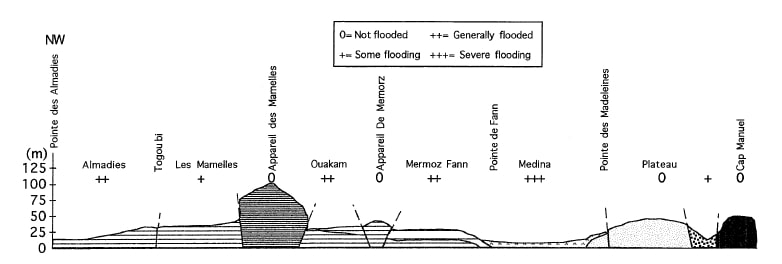
Dakar is the capital and largest city of Senegal, with a population of 1 million in the city proper, and about 2.5 million in its metropolitan area. It experiences frequent flooding due to both geographical and man-made factors. Geographically, it features many natural bowl-shaped areas that easily accumulate water.

sea level rise by 2100 Dakar

Side-on view of Dakar’s topology, with flood risk associated with each area. Source: Lo, Diop (2000).

On the human side, persistent droughts have made rural life difficult in Senegal, driving urban migration and thus rapid urban expansion in Dakar. As wetlands, woodlands and farmlands were replaced with non-permeable surfaces, natural drainage was reduced, contributing to heightened flood risk. The city’s surface area increased by 25% between 1998 and 2008 and has continued to add new neighborhoods with no drainage canals or sewage systems. Where these are present, they are often under-developed and unable to handle heavy downpours. A catastrophic flood in 2012 resulted in the loss of life, sewage water overflow bringing disease and massive infrastructure degradation. 

In response to this event, the government adopted a USD $1.4 billion Decennial Flood Management Program with contributions from the World Bank. The plan entails infrastructure for flood control along with policy and institutional planning for urban development, renovation, and wetland management. Will this be enough to withstand the 1 to 2 meters sea level rise projected to occur by 2100? 

Even installations such as Tokyo’s G-cans will be pushed to the limit, and Dakar’s plans seem more conventional. Earth.Org has modelled what severe floods could look like in Dakar by the end of the century. 

sea level rise by 2100 dakar

Sea level rise projections by 2100 for two scenarios with the amount of rise in meters indicated (mild = 1m; extreme = 3m). Percentage and total population displacement indicated bottom right.

Methodology

Global mean sea level is projected to rise by 2m at the end of this century. However, in order to determine local sea level rise (SLR), one has to take into account local coastal flood levels which could be 2.8m above Mean Higher-High Water (MHHW) at extreme forecasts. These local levels bring variability to the projected SLR from 1m to 6.5m (eg. Rio vs Kolkata).

The SLR scenarios used in this study are based on the forecasts from Climate Central – Coastal Risk Screening Tool  with the following parameters:

  • Sea level Projection Source
  • Coastal Flood Level
  • Pollution Scenario
  • Luck

Sea level Projection Source:

From two highly cited journals by Kopp et al., estimating SLR mainly due to ocean thermal expansion and ice melt. The mid-range scenario projected 0.5-1.2m of SLR based on different representative concentration pathways (RCP) defined by the IPCC. While the pessimistic scenario added more mechanisms of ice-sheet melting, estimating SLR at 1m-2.5m in 2100, with a projection of 10m SLR at 2300.

Coastal Flooding

More frequent coastal flooding is a direct impact of sea-level rise. Based on the Global tides and surge reanalysis by Muis et al., (2016), it is estimated that the extreme coastal water level could be from 0.2 – 2.8m over the mean level. While in extreme cases like China and the Netherlands it could experience 5-10m of extreme sea levels. Here, the coastal local flood level is added on top of the projected SLR.

Pollution Scenario:

Allows choosing the RCP, the greenhouse gas concentration trajectory defined by the IPCC.  The mild level is based on RCP4.5, of 2°C temperature rise; while the Extreme level is based on RCP 8.5, of 4°C temperature rise.

Luck:

Applies to the baseline SLR, defined in the “Sea level projection” section, upon which we add flooding. “Mild” refers to the mid-range scenario of 0.5-1.2m, and “extreme” to the pessimistic scenario of 1-2.5m. We used the high-end value of each scenario (mild = 1m; extreme = 2.5m).

You might also like: Sea Level Rise by the End of the Century – New York City

References:
  • Kulp, Scott A., and Benjamin H. Strauss. “New elevation data triple estimates of global vulnerability to sea-level rise and coastal flooding.” Nature communications 10.1 (2019): 1-12.
  • Florczyk, A. J., Corbane, C., Ehrlich, D., Freire, S., Kemper, T., Maffenini, L., Melchiorri, M., Politis, P., Schiavina, M., Sabo, F. & Zanchetta, L. (2019). GHSL Data Package 2019 Public Release.
  • Kopp, R. E., DeConto, R. M., Bader, D. A., Hay, C. C., Horton, R. M., Kulp, S., Oppenheimer, M., Pollard, D. & Strauss, B. H. (2017). Evolving Understanding of Antarctic Ice-Sheet Physics and Ambiguity in Probabilistic Sea-Level Projections. Earth’s Future, 5(12), 1217–1233.
  • Kopp, R. E., Horton, R. M., Little, C. M., Mitrovica, J. X., Oppenheimer, M., Rasmussen, D. J., Strauss, B. H. & Tebaldi, C. (2014). Probabilistic 21st and 22nd Century Sea-Level Projections at a Global Network of Tide-Gauge Sites. Earth’s Future, 2(8), 383–406.
  • Kulp, S. A. & Strauss, B. H. (2019). New Elevation Data Triple Estimates of Global Vulnerability to Sea-Level Rise and Coastal Flooding. Nature Communications, 10(1), 4844. Retrieved June 21, 2020, from http://www.nature.com/articles/s41467-019-12808-z
  • Muis, S., Verlaan, M., Winsemius, H. C., Aerts, J. C. J. H. & Ward, P. J. (2016). A Global Reanalysis of Storm Surges and Extreme Sea Levels. Nature Communications, 7.
  • Lo, P. G., and M. B. Diop. “Problems associated with flooding in Dakar, western Senegal: influence of geological setting and town management.” Bulletin of Engineering Geology and the Environment 58.2 (2000): 145-149.

Although not frequent, Melbourne sometimes experiences strong storms that can cause flash floods. Recent sea level rise projections of 1 to 2 meters threaten large portions of the city with higher flood risks.

Earth.Org has mapped what such flooding could look like by 2100.

—

Melbourne is the second most populated city in Australia and Oceania with 5 million inhabitants. Home to many landmarks, it is a renowned cultural center and often hosts international events. Consistently voted most liveable city in the 2010s, quality of life in Melbourne could be seriously dampened by sea level rise. 

A recent paper published in Nature estimates that, under high emissions scenarios, global sea levels could rise by an average of 1 to 2 meters by 2100. This would flood several low-lying suburbs in Melbourne without extreme weather events, possibly forcing the relocation of their population. A serious flood on top of this could cause damage to some of the more critical infrastructure of the city, including its record-holding tram network. 

The revised models will hopefully stir a relatively climate change-skeptical government into action. Research bodies for climate adaptation have received funding cuts from the federal government, which hopefully will be reversed be it is too late. Earth.Org has modelled what sea level rise could look like by 2100 to illustrate the need for protective measures.

sea level rise by 2100 melbourne

Sea level rise projections by 2100 for two scenarios with the amount of rise in meters indicated (mild = 2m; extreme = 4m). Percentage and total population displacement indicated bottom right.

Methodology

Global mean sea level is projected to rise by 2m at the end of this century. However, in order to determine local sea level rise (SLR), one has to take into account local coastal flood levels which could be 2.8m above Mean Higher-High Water (MHHW) at extreme forecasts. These local levels bring variability to the projected SLR from 1m to 6.5m (eg. Rio vs Kolkata).

The SLR scenarios used in this study are based on the forecasts from Climate Central – Coastal Risk Screening Tool  with the following parameters:

  • Sea level Projection Source
  • Coastal Flood Level
  • Pollution Scenario
  • Luck

Sea level Projection Source:

From two highly cited journals by Kopp et al., estimating SLR mainly due to ocean thermal expansion and ice melt. The mid-range scenario projected 0.5-1.2m of SLR based on different representative concentration pathways (RCP) defined by the IPCC. While the pessimistic scenario added more mechanisms of ice-sheet melting, estimating SLR at 1m-2.5m in 2100, with a projection of 10m SLR at 2300.

Coastal Flooding

More frequent coastal flooding is a direct impact of sea-level rise. Based on the Global tides and surge reanalysis by Muis et al., (2016), it is estimated that the extreme coastal water level could be from 0.2 – 2.8m over the mean level. While in extreme cases like China and the Netherlands it could experience 5-10m of extreme sea levels. Here, the coastal local flood level is added on top of the projected SLR.

Pollution Scenario:

Allows choosing the RCP, the greenhouse gas concentration trajectory defined by the IPCC.  The mild level is based on RCP4.5, of 2°C temperature rise; while the Extreme level is based on RCP 8.5, of 4°C temperature rise.

Luck:

Applies to the baseline SLR, defined in the “Sea level projection” section, upon which we add flooding. “Mild” refers to the mid-range scenario of 0.5-1.2m, and “extreme” to the pessimistic scenario of 1-2.5m. We used the high-end value of each scenario (mild = 1m; extreme = 2.5m).

You might also like: Sea Level Rise by the End of the Century – New York City

References:
  • Kulp, Scott A., and Benjamin H. Strauss. “New elevation data triple estimates of global vulnerability to sea-level rise and coastal flooding.” Nature communications 10.1 (2019): 1-12.
  • Florczyk, A. J., Corbane, C., Ehrlich, D., Freire, S., Kemper, T., Maffenini, L., Melchiorri, M., Politis, P., Schiavina, M., Sabo, F. & Zanchetta, L. (2019). GHSL Data Package 2019 Public Release.
  • Kopp, R. E., DeConto, R. M., Bader, D. A., Hay, C. C., Horton, R. M., Kulp, S., Oppenheimer, M., Pollard, D. & Strauss, B. H. (2017). Evolving Understanding of Antarctic Ice-Sheet Physics and Ambiguity in Probabilistic Sea-Level Projections. Earth’s Future, 5(12), 1217–1233.
  • Kopp, R. E., Horton, R. M., Little, C. M., Mitrovica, J. X., Oppenheimer, M., Rasmussen, D. J., Strauss, B. H. & Tebaldi, C. (2014). Probabilistic 21st and 22nd Century Sea-Level Projections at a Global Network of Tide-Gauge Sites. Earth’s Future, 2(8), 383–406.
  • Kulp, S. A. & Strauss, B. H. (2019). New Elevation Data Triple Estimates of Global Vulnerability to Sea-Level Rise and Coastal Flooding. Nature Communications, 10(1), 4844. Retrieved June 21, 2020, from http://www.nature.com/articles/s41467-019-12808-z
  • Muis, S., Verlaan, M., Winsemius, H. C., Aerts, J. C. J. H. & Ward, P. J. (2016). A Global Reanalysis of Storm Surges and Extreme Sea Levels. Nature Communications, 7.
Subscribe to our newsletters

The best environmental stories of the week and month, handpicked by our Editor. Make sure you're on top of what's new in the climate.

SUBSCRIBE