

Many districts in Dakar, the capital of Senegal, are flooded for weeks every year during the rainy season. Aside from damaging roads and homes, water surges also promote mosquito proliferation and contaminate drinking water with disease. Sea level rise is expected to increase the likelihood of severe flooding, and officials need a plan if they are to avoid quality of life and economic loss.
Earth.org has mapped extreme flooding in Dakar by 2100 as a call to action.
—
Dakar is the capital and largest city of Senegal, with a population of 1 million in the city proper, and about 2.5 million in its metropolitan area. It experiences frequent flooding due to both geographical and man-made factors. Geographically, it features many natural bowl-shaped areas that easily accumulate water.
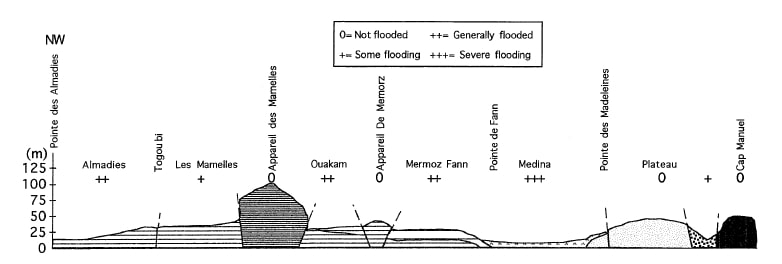
Side-on view of Dakar’s topology, with flood risk associated with each area. Source: Lo, Diop (2000).
On the human side, persistent droughts have made rural life difficult in Senegal, driving urban migration and thus rapid urban expansion in Dakar. As wetlands, woodlands and farmlands were replaced with non-permeable surfaces, natural drainage was reduced, contributing to heightened flood risk. The city’s surface area increased by 25% between 1998 and 2008 and has continued to add new neighborhoods with no drainage canals or sewage systems. Where these are present, they are often under-developed and unable to handle heavy downpours. A catastrophic flood in 2012 resulted in the loss of life, sewage water overflow bringing disease and massive infrastructure degradation.
In response to this event, the government adopted a USD $1.4 billion Decennial Flood Management Program with contributions from the World Bank. The plan entails infrastructure for flood control along with policy and institutional planning for urban development, renovation, and wetland management. Will this be enough to withstand the 1 to 2 meters sea level rise projected to occur by 2100?
Even installations such as Tokyo’s G-cans will be pushed to the limit, and Dakar’s plans seem more conventional. Earth.Org has modelled what severe floods could look like in Dakar by the end of the century.
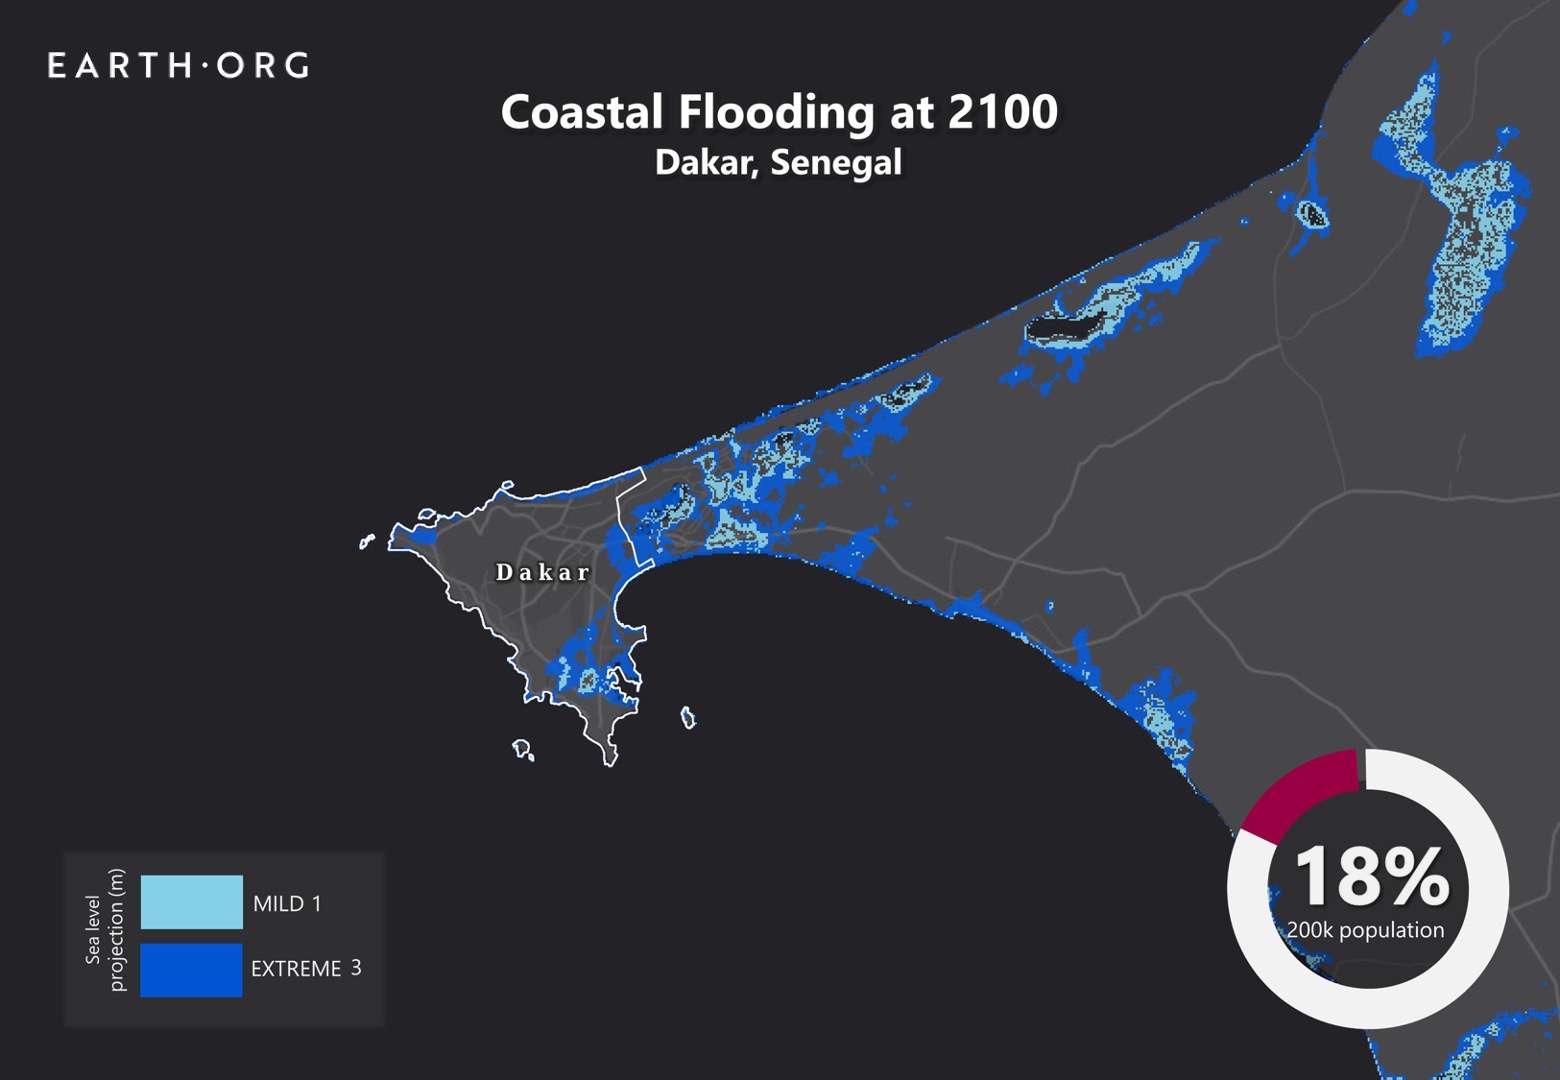
Sea level rise projections by 2100 for two scenarios with the amount of rise in meters indicated (mild = 1m; extreme = 3m). Percentage and total population displacement indicated bottom right.
Methodology
Global mean sea level is projected to rise by 2m at the end of this century. However, in order to determine local sea level rise (SLR), one has to take into account local coastal flood levels which could be 2.8m above Mean Higher-High Water (MHHW) at extreme forecasts. These local levels bring variability to the projected SLR from 1m to 6.5m (eg. Rio vs Kolkata).
The SLR scenarios used in this study are based on the forecasts from Climate Central – Coastal Risk Screening Tool with the following parameters:
- Sea level Projection Source
- Coastal Flood Level
- Pollution Scenario
- Luck
Sea level Projection Source:
From two highly cited journals by Kopp et al., estimating SLR mainly due to ocean thermal expansion and ice melt. The mid-range scenario projected 0.5-1.2m of SLR based on different representative concentration pathways (RCP) defined by the IPCC. While the pessimistic scenario added more mechanisms of ice-sheet melting, estimating SLR at 1m-2.5m in 2100, with a projection of 10m SLR at 2300.
Coastal Flooding
More frequent coastal flooding is a direct impact of sea-level rise. Based on the Global tides and surge reanalysis by Muis et al., (2016), it is estimated that the extreme coastal water level could be from 0.2 – 2.8m over the mean level. While in extreme cases like China and the Netherlands it could experience 5-10m of extreme sea levels. Here, the coastal local flood level is added on top of the projected SLR.
Pollution Scenario:
Allows choosing the RCP, the greenhouse gas concentration trajectory defined by the IPCC. The mild level is based on RCP4.5, of 2°C temperature rise; while the Extreme level is based on RCP 8.5, of 4°C temperature rise.
Luck:
Applies to the baseline SLR, defined in the “Sea level projection” section, upon which we add flooding. “Mild” refers to the mid-range scenario of 0.5-1.2m, and “extreme” to the pessimistic scenario of 1-2.5m. We used the high-end value of each scenario (mild = 1m; extreme = 2.5m).
You might also like: Sea Level Rise by the End of the Century – New York City
References:
-
Kulp, Scott A., and Benjamin H. Strauss. “New elevation data triple estimates of global vulnerability to sea-level rise and coastal flooding.” Nature communications 10.1 (2019): 1-12.
-
Florczyk, A. J., Corbane, C., Ehrlich, D., Freire, S., Kemper, T., Maffenini, L., Melchiorri, M., Politis, P., Schiavina, M., Sabo, F. & Zanchetta, L. (2019). GHSL Data Package 2019 Public Release.
-
Kopp, R. E., DeConto, R. M., Bader, D. A., Hay, C. C., Horton, R. M., Kulp, S., Oppenheimer, M., Pollard, D. & Strauss, B. H. (2017). Evolving Understanding of Antarctic Ice-Sheet Physics and Ambiguity in Probabilistic Sea-Level Projections. Earth’s Future, 5(12), 1217–1233.
-
Kopp, R. E., Horton, R. M., Little, C. M., Mitrovica, J. X., Oppenheimer, M., Rasmussen, D. J., Strauss, B. H. & Tebaldi, C. (2014). Probabilistic 21st and 22nd Century Sea-Level Projections at a Global Network of Tide-Gauge Sites. Earth’s Future, 2(8), 383–406.
-
Kulp, S. A. & Strauss, B. H. (2019). New Elevation Data Triple Estimates of Global Vulnerability to Sea-Level Rise and Coastal Flooding. Nature Communications, 10(1), 4844. Retrieved June 21, 2020, from http://www.nature.com/articles/s41467-019-12808-z
-
Muis, S., Verlaan, M., Winsemius, H. C., Aerts, J. C. J. H. & Ward, P. J. (2016). A Global Reanalysis of Storm Surges and Extreme Sea Levels. Nature Communications, 7.
-
Lo, P. G., and M. B. Diop. “Problems associated with flooding in Dakar, western Senegal: influence of geological setting and town management.” Bulletin of Engineering Geology and the Environment 58.2 (2000): 145-149.


![The Statistics of Biodiversity Loss [2020 WWF Report]](https://earth.org/wp-content/uploads/2020/12/lprwinkyTHB-544x306.jpg)


