


The 33 islands of Kiribati are notoriously vulnerable to sea level rise; the highest point on many of the islands like South Tarawa is just a few meters above sea level. The impending threats of land loss, storm surge amplification, and permanent population displacement are becoming visible, and officials must decide on a strategy.
Earth.Org has mapped what extreme flooding could look like by 2100 to illustrate the need for action.
—
Kiribati is an island nation in the central Pacific, which is expected to be the first country fully submerged by sea level rise. The islands are atolls and have a high ratio of coastline to land area. In 1989, a UN report on the greenhouse effect had listed the country as one of the countries at risk from rising sea levels. Ten years later, two of Kiribati’s uninhabited islands, Abanuea and Tebua Tarawa, disappeared under the waves.
Most of its 112,000 inhabitants live on the atoll of Tarawa, where the capital is located, sitting at less than 3 meters above sea level. The projected 1 to 2 meter global sea level rise by 2100 is quite likely to make it uninhabitable.
The Kiribati government has bought land in Fiji to serve as a place to evacuate the country’s entire population should the worst case scenario come to pass. New Zealand’s government has also responded to the needs of Kiribatians, letting 75 people migrate to New Zealand per year.
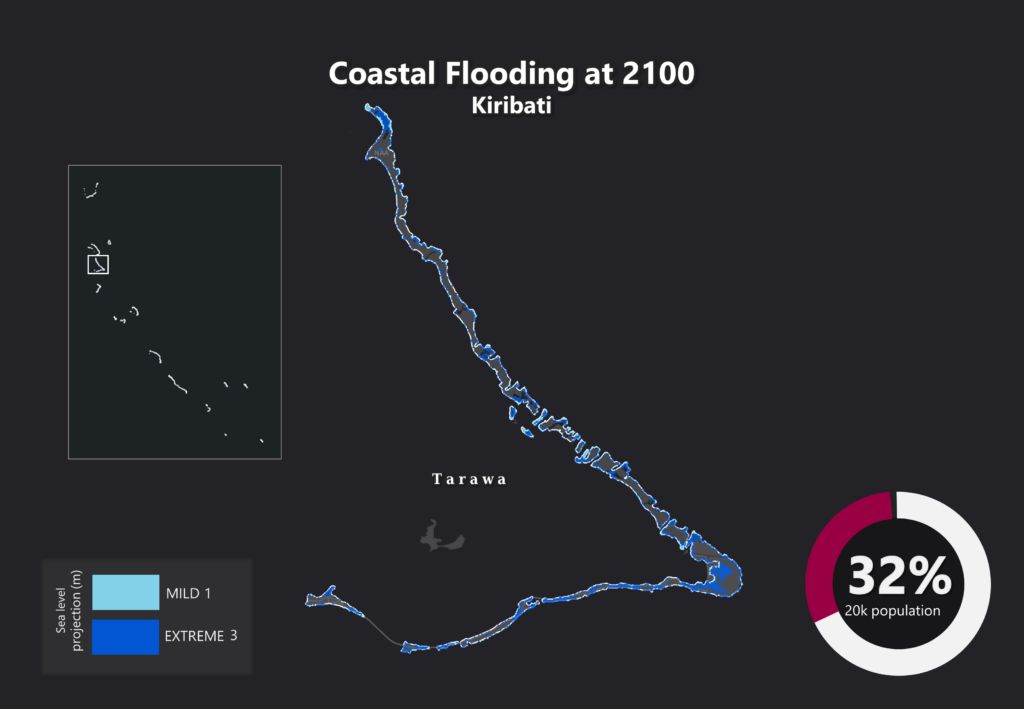
We hope that international help will continue to come through for those whose homes could be lost to climate change. Earth.Org has mapped extreme flooding on Tarawa by 2100 to illustrate the very real consequences of climate change.

Sea level rise projections by 2100 for two scenarios with the amount of rise in meters indicated (mild = 1m; extreme = 3m). Percentage and total population displacement indicated bottom right.
Methodology
Global mean sea level is projected to rise by 2m at the end of this century. However, in order to determine local sea level rise (SLR), one has to take into account local coastal flood levels which could be 2.8m above Mean Higher-High Water (MHHW) at extreme forecasts. These local levels bring variability to the projected SLR from 1m to 6.5m (eg. Rio vs Kolkata).
The SLR scenarios used in this study are based on the forecasts from Climate Central – Coastal Risk Screening Tool with the following parameters:
- Sea level Projection Source
- Coastal Flood Level
- Pollution Scenario
- Luck
Sea level Projection Source:
From two highly cited journals by Kopp et al., estimating SLR mainly due to ocean thermal expansion and ice melt. The mid-range scenario projected 0.5-1.2m of SLR based on different representative concentration pathways (RCP) defined by the IPCC. While the pessimistic scenario added more mechanisms of ice-sheet melting, estimating SLR at 1m-2.5m in 2100, with a projection of 10m SLR at 2300.
Coastal Flooding
More frequent coastal flooding is a direct impact of sea-level rise. Based on the Global tides and surge reanalysis by Muis et al., (2016), it is estimated that the extreme coastal water level could be from 0.2 – 2.8m over the mean level. While in extreme cases like China and the Netherlands it could experience 5-10m of extreme sea levels. Here, the coastal local flood level is added on top of the projected SLR.
Pollution Scenario:
Allows choosing the RCP, the greenhouse gas concentration trajectory defined by the IPCC. The mild level is based on RCP4.5, of 2°C temperature rise; while the Extreme level is based on RCP 8.5, of 4°C temperature rise.
Luck:
Applies to the baseline SLR, defined in the “Sea level projection” section, upon which we add flooding. “Mild” refers to the mid-range scenario of 0.5-1.2m, and “extreme” to the pessimistic scenario of 1-2.5m. We used the high-end value of each scenario (mild = 1m; extreme = 2.5m).
Mapping by Braundt Lau. Article written by Wing Ki Leung and Owen Mulhern.
You might also like: Sea Level Rise by 2100 – Miami
References:
-
Kulp, Scott A., and Benjamin H. Strauss. “New elevation data triple estimates of global vulnerability to sea-level rise and coastal flooding.” Nature communications 10.1 (2019): 1-12.
-
Florczyk, A. J., Corbane, C., Ehrlich, D., Freire, S., Kemper, T., Maffenini, L., Melchiorri, M., Politis, P., Schiavina, M., Sabo, F. & Zanchetta, L. (2019). GHSL Data Package 2019 Public Release.
-
Kopp, R. E., DeConto, R. M., Bader, D. A., Hay, C. C., Horton, R. M., Kulp, S., Oppenheimer, M., Pollard, D. & Strauss, B. H. (2017). Evolving Understanding of Antarctic Ice-Sheet Physics and Ambiguity in Probabilistic Sea-Level Projections. Earth’s Future, 5(12), 1217–1233.
-
Kopp, R. E., Horton, R. M., Little, C. M., Mitrovica, J. X., Oppenheimer, M., Rasmussen, D. J., Strauss, B. H. & Tebaldi, C. (2014). Probabilistic 21st and 22nd Century Sea-Level Projections at a Global Network of Tide-Gauge Sites. Earth’s Future, 2(8), 383–406.
-
Kulp, S. A. & Strauss, B. H. (2019). New Elevation Data Triple Estimates of Global Vulnerability to Sea-Level Rise and Coastal Flooding. Nature Communications, 10(1), 4844. Retrieved June 21, 2020, from http://www.nature.com/articles/s41467-019-12808-z
-
Muis, S., Verlaan, M., Winsemius, H. C., Aerts, J. C. J. H. & Ward, P. J. (2016). A Global Reanalysis of Storm Surges and Extreme Sea Levels. Nature Communications, 7.


![The Statistics of Biodiversity Loss [2020 WWF Report]](https://earth.org/wp-content/uploads/2020/12/lprwinkyTHB-544x306.jpg)


