

Recent studies have stated the likely 1 to 2 meter global average sea level rise we could experience by 2100. On the Marshall islands, where a 91cm rise would make most of the island uninhabitable, a strategy must be decided on now.
Earth.Org has mapped what extreme flooding could look like by 2100 to illustrate the need for action.
—
The Marshall Islands, a string of atolls in the central Pacific Ocean, is among the countries most imminently threatened by unchecked climate change. The islands consist of 29 atolls with an average elevation of 2 metres, and sea levels are rising at twice the global average rate. By 2030, under a high emission scenario, sea level rise is projected to be in the range of 3 to 16cm; significantly increasing the frequency and the impact of storm surges and coastal flooding.
Researchers at the University of Hawaii produced some shocking sea level rise projections of Majuro, capital atoll of the Marshall Islands and the main international port of the nation. High-end sea level rise projections put the majority of its land area underwater by 2050, but the freshwater resources could become undrinkable well before then due to saltwater contamination. Everyday life on the islands is already made difficult by extreme weather events, which pushed more than 20,000 Marshallese climate refugees emigrated to the U.S. in 2016.
While short-term mitigation measures like sandbags or piecemeal barriers are used to help keep storm surges at bay, the need for a long-term solution grows with every centimeter of sea level rise. For the small island nation, stronger measures can come at a steep and prohibitive cost, leaving on relocation as a sad necessity.
Earth.Org has mapped the flooding these islands could face by the end of the century as a call for awareness.

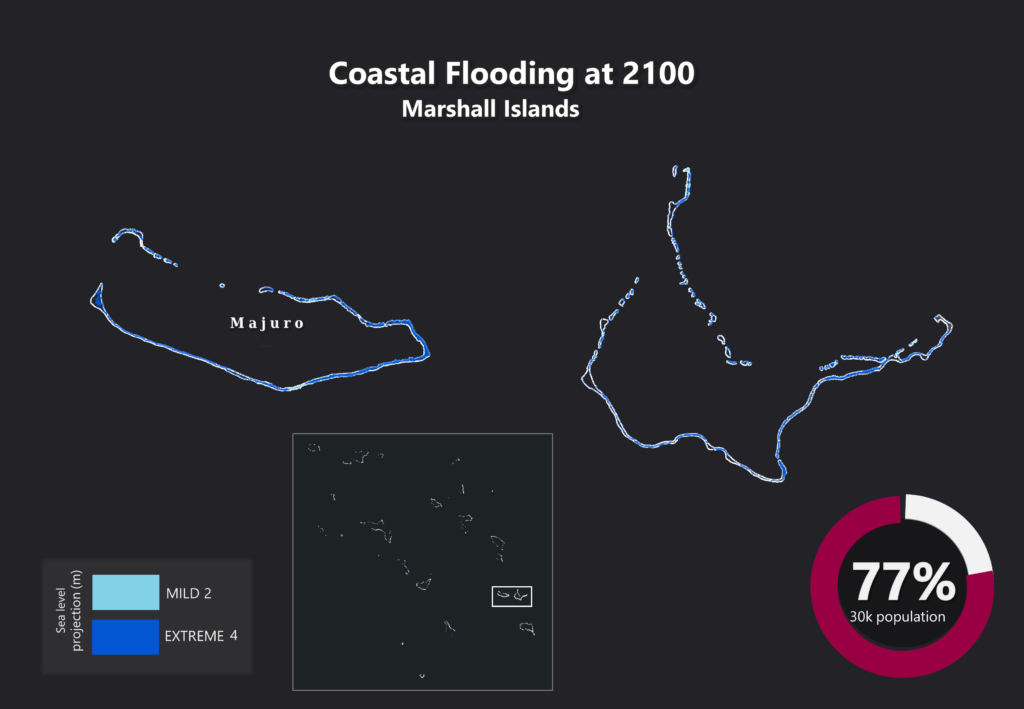
Sea level rise projections by 2100 on the Marshall Islands. Two scenarios are depicted with the amount of rise in meters indicated (mild = 2m; extreme = 4m). Percentage and total population displacement indicated bottom right.
Methodology
Global mean sea level is projected to rise by 2m at the end of this century. However, in order to determine local sea level rise (SLR), one has to take into account local coastal flood levels which could be 2.8m above Mean Higher-High Water (MHHW) at extreme forecasts. These local levels bring variability to the projected SLR from 1m to 6.5m (eg. Rio vs Kolkata).
The SLR scenarios used in this study are based on the forecasts from Climate Central – Coastal Risk Screening Tool with the following parameters:
- Sea level Projection Source
- Coastal Flood Level
- Pollution Scenario
- Luck
Sea level Projection Source:
From two highly cited journals by Kopp et al., estimating SLR mainly due to ocean thermal expansion and ice melt. The mid-range scenario projected 0.5-1.2m of SLR based on different representative concentration pathways (RCP) defined by the IPCC. While the pessimistic scenario added more mechanisms of ice-sheet melting, estimating SLR at 1m-2.5m in 2100, with a projection of 10m SLR at 2300.
Coastal Flooding
More frequent coastal flooding is a direct impact of sea-level rise. Based on the Global tides and surge reanalysis by Muis et al., (2016), it is estimated that the extreme coastal water level could be from 0.2 – 2.8m over the mean level. While in extreme cases like China and the Netherlands it could experience 5-10m of extreme sea levels. Here, the coastal local flood level is added on top of the projected SLR.
Pollution Scenario:
Allows choosing the RCP, the greenhouse gas concentration trajectory defined by the IPCC. The mild level is based on RCP4.5, of 2°C temperature rise; while the Extreme level is based on RCP 8.5, of 4°C temperature rise.
Luck:
Applies to the baseline SLR, defined in the “Sea level projection” section, upon which we add flooding. “Mild” refers to the mid-range scenario of 0.5-1.2m, and “extreme” to the pessimistic scenario of 1-2.5m. We used the high-end value of each scenario (mild = 1m; extreme = 2.5m).
Mapping by Braundt Lau. Article written by Wing Ki Leung and Owen Mulhern.
You might also like: Sea Level Rise by 2100 – Miami
References:
-
Kulp, Scott A., and Benjamin H. Strauss. “New elevation data triple estimates of global vulnerability to sea-level rise and coastal flooding.” Nature communications 10.1 (2019): 1-12.
-
Florczyk, A. J., Corbane, C., Ehrlich, D., Freire, S., Kemper, T., Maffenini, L., Melchiorri, M., Politis, P., Schiavina, M., Sabo, F. & Zanchetta, L. (2019). GHSL Data Package 2019 Public Release.
-
Kopp, R. E., DeConto, R. M., Bader, D. A., Hay, C. C., Horton, R. M., Kulp, S., Oppenheimer, M., Pollard, D. & Strauss, B. H. (2017). Evolving Understanding of Antarctic Ice-Sheet Physics and Ambiguity in Probabilistic Sea-Level Projections. Earth’s Future, 5(12), 1217–1233.
-
Kopp, R. E., Horton, R. M., Little, C. M., Mitrovica, J. X., Oppenheimer, M., Rasmussen, D. J., Strauss, B. H. & Tebaldi, C. (2014). Probabilistic 21st and 22nd Century Sea-Level Projections at a Global Network of Tide-Gauge Sites. Earth’s Future, 2(8), 383–406.
-
Kulp, S. A. & Strauss, B. H. (2019). New Elevation Data Triple Estimates of Global Vulnerability to Sea-Level Rise and Coastal Flooding. Nature Communications, 10(1), 4844. Retrieved June 21, 2020, from http://www.nature.com/articles/s41467-019-12808-z
-
Muis, S., Verlaan, M., Winsemius, H. C., Aerts, J. C. J. H. & Ward, P. J. (2016). A Global Reanalysis of Storm Surges and Extreme Sea Levels. Nature Communications, 7.


![The Statistics of Biodiversity Loss [2020 WWF Report]](https://earth.org/wp-content/uploads/2020/12/lprwinkyTHB-544x306.jpg)


