

The Commonwealth of the North Mariana Islands (CNMI) is an island chain located in the western Pacific. Saipan, the archipelago’s main island, is identified as critically vulnerable to sea level rise and changes in rainfall patterns by the CNMI Climate Change Working Group. Sea level around the islands is expected to rise by more than 1 metre by 2100, which puts the majority of the islands’ low lying areas at high risk.
Earth.Org has mapped what extreme flooding could look like by 2100 to illustrate the need for action.
—
CNMI consists of 15 islands, which are the northernmost islands in the Mariana Archipelago. The majority of the population resides on the islands of Saipan, Tinian and Rota, with Saipan being the largest in terms of size. Sea level has been rising in CNMI at a rate of about 7.62 mm per year, which is more than twice the global average, with an expected 1 m by the end of the century.
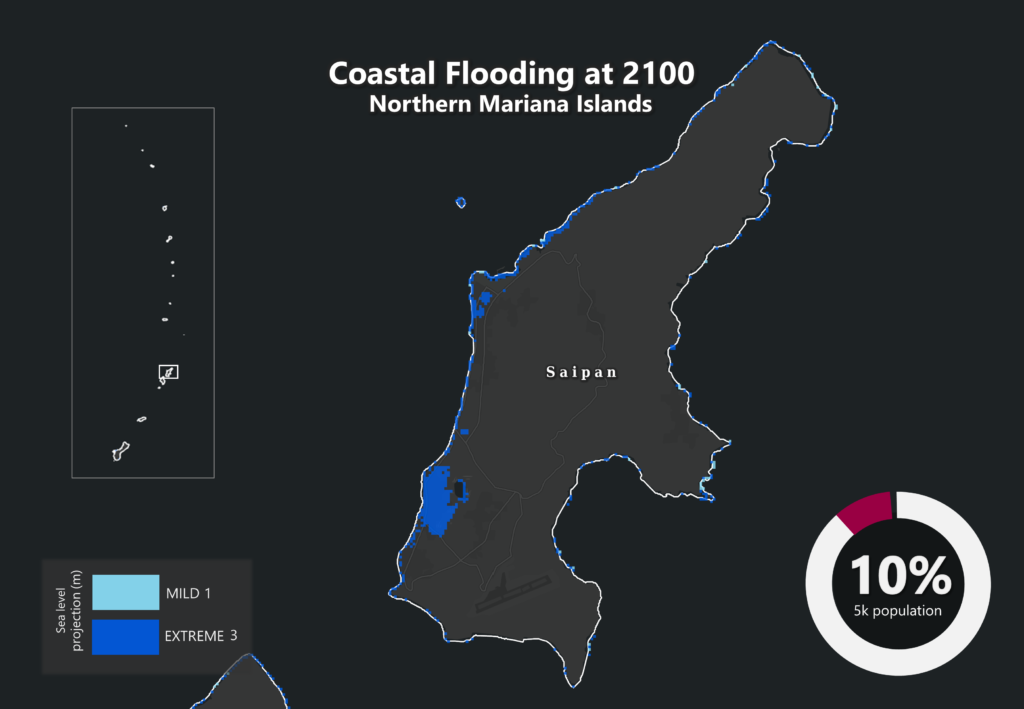
Saipan is an important location of CNMI, out of 53,883 permanent residents, 52,263 of them live on Saipan. Its western coastal plain is composed of natural habitat, residential neighbourhoods and the primary business district of Garapan. A vulnerability assessment was done by the CNMI Climate Change Working Group and the result identified nearly all of the villages and resources in the area as being critically vulnerable to sea-level rise and changes in rainfall patterns. Around 80% of the coast is expected to be inundated using the projection of 0.91 metres of sea level rise, which could force mass relocation inland or off the islands.
Earth.Org has mapped what severe flooding could look like on Saipan by 2100 to illustrate.
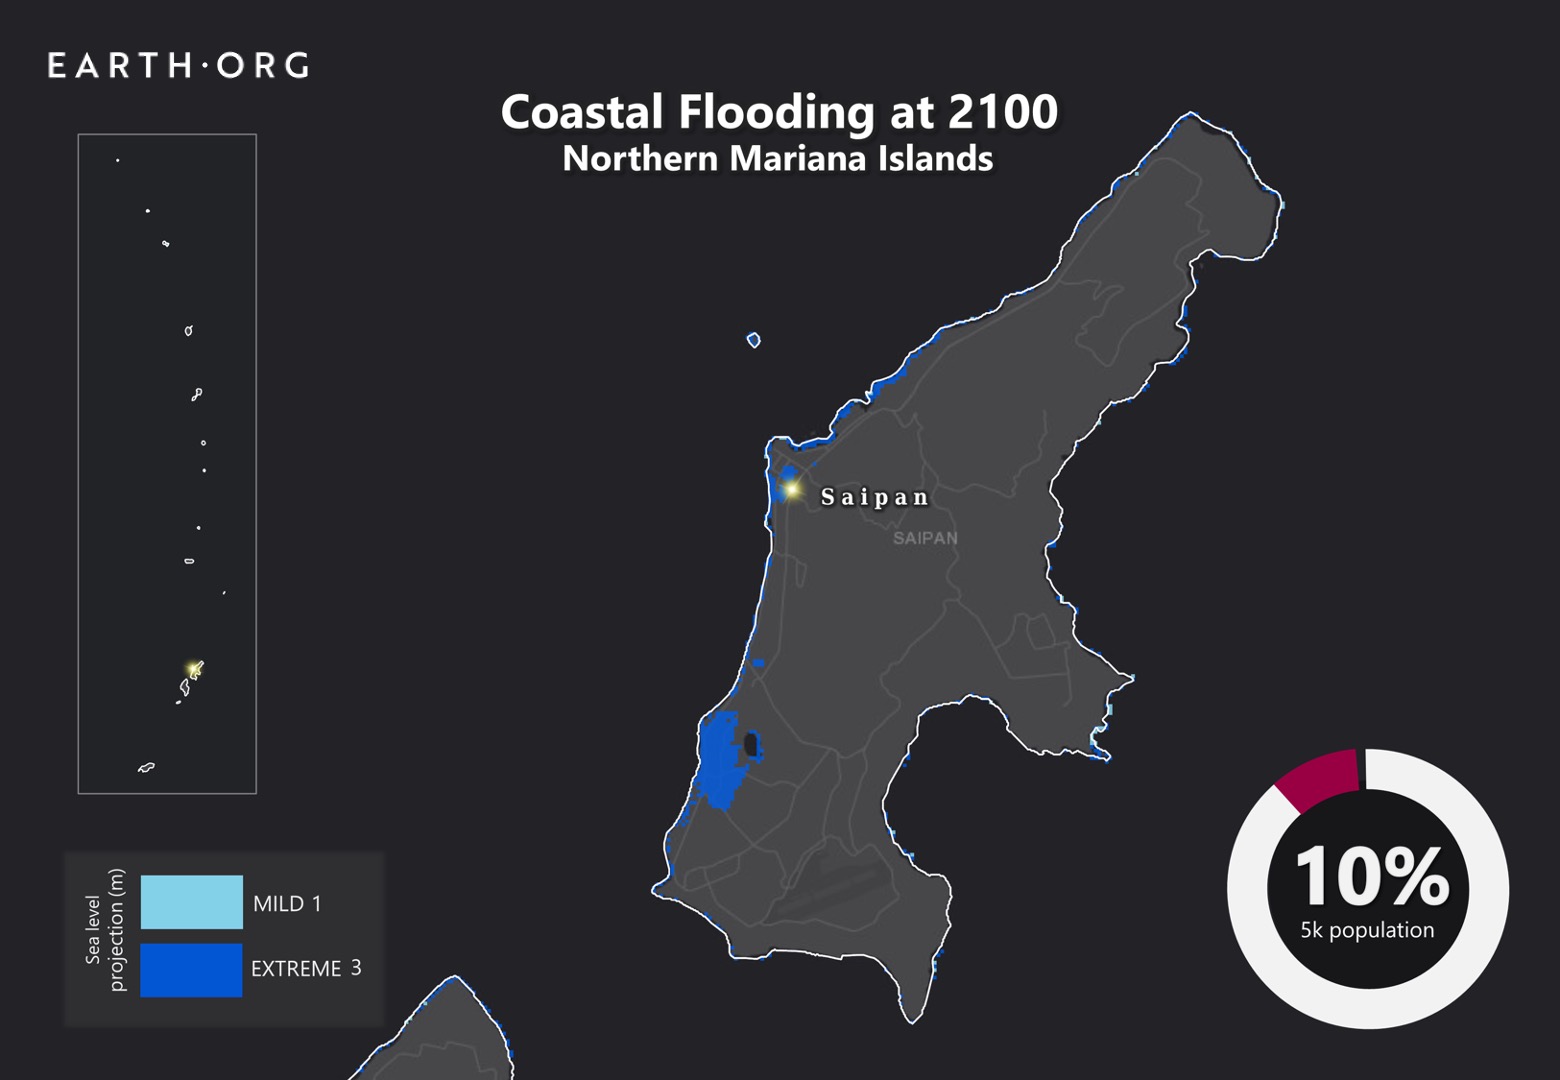
Sea level rise projections by 2100 for two scenarios with the amount of rise in meters indicated (mild = 1m; extreme = 3m). Population displacement indicated bottom right.
Sea level rise mapping methodology
Global mean sea level is projected to rise by 2m at the end of this century. However, in order to determine local sea level rise (SLR), one has to take into account local coastal flood levels which could be 2.8m above Mean Higher-High Water (MHHW) at extreme forecasts. These local levels bring variability to the projected SLR from 1m to 6.5m (eg. Rio vs Kolkata).
The SLR scenarios used in this study are based on the forecasts from Climate Central – Coastal Risk Screening Tool with the following parameters:
- Sea level Projection Source
- Coastal Flood Level
- Pollution Scenario
- Luck
Sea level Projection Source:
From two highly cited journals by Kopp et al., estimating SLR mainly due to ocean thermal expansion and ice melt. The mid-range scenario projected 0.5-1.2m of SLR based on different representative concentration pathways (RCP) defined by the IPCC. While the pessimistic scenario added more mechanisms of ice-sheet melting, estimating SLR at 1m-2.5m in 2100, with a projection of 10m SLR at 2300.
Coastal Flooding
More frequent coastal flooding is a direct impact of sea-level rise. Based on the Global tides and surge reanalysis by Muis et al., (2016), it is estimated that the extreme coastal water level could be from 0.2 – 2.8m over the mean level. While in extreme cases like China and the Netherlands it could experience 5-10m of extreme sea levels. Here, the coastal local flood level is added on top of the projected SLR.
Pollution Scenario:
Allows choosing the RCP, the greenhouse gas concentration trajectory defined by the IPCC. The mild level is based on RCP4.5, of 2°C temperature rise; while the Extreme level is based on RCP 8.5, of 4°C temperature rise.
Luck:
Applies to the baseline SLR, defined in the “Sea level projection” section, upon which we add flooding. “Mild” refers to the mid-range scenario of 0.5-1.2m, and “extreme” to the pessimistic scenario of 1-2.5m. We used the high-end value of each scenario (mild = 1m; extreme = 2.5m).
Mapping by Braundt Lau. Article written by Wing Ki Leung and Owen Mulhern.
You might also like: Sea Level Rise by 2100 – Miami
References:
-
Kulp, Scott A., and Benjamin H. Strauss. “New elevation data triple estimates of global vulnerability to sea-level rise and coastal flooding.” Nature communications 10.1 (2019): 1-12.
-
Florczyk, A. J., Corbane, C., Ehrlich, D., Freire, S., Kemper, T., Maffenini, L., Melchiorri, M., Politis, P., Schiavina, M., Sabo, F. & Zanchetta, L. (2019). GHSL Data Package 2019 Public Release.
-
Kopp, R. E., DeConto, R. M., Bader, D. A., Hay, C. C., Horton, R. M., Kulp, S., Oppenheimer, M., Pollard, D. & Strauss, B. H. (2017). Evolving Understanding of Antarctic Ice-Sheet Physics and Ambiguity in Probabilistic Sea-Level Projections. Earth’s Future, 5(12), 1217–1233.
-
Kopp, R. E., Horton, R. M., Little, C. M., Mitrovica, J. X., Oppenheimer, M., Rasmussen, D. J., Strauss, B. H. & Tebaldi, C. (2014). Probabilistic 21st and 22nd Century Sea-Level Projections at a Global Network of Tide-Gauge Sites. Earth’s Future, 2(8), 383–406.
-
Kulp, S. A. & Strauss, B. H. (2019). New Elevation Data Triple Estimates of Global Vulnerability to Sea-Level Rise and Coastal Flooding. Nature Communications, 10(1), 4844. Retrieved June 21, 2020, from http://www.nature.com/articles/s41467-019-12808-z
-
Muis, S., Verlaan, M., Winsemius, H. C., Aerts, J. C. J. H. & Ward, P. J. (2016). A Global Reanalysis of Storm Surges and Extreme Sea Levels. Nature Communications, 7.


![The Statistics of Biodiversity Loss [2020 WWF Report]](https://earth.org/wp-content/uploads/2020/12/lprwinkyTHB-544x306.jpg)


