

Palau is a small nation with exceptional biodiversity in the western Pacific Ocean. It has one of the largest tropical rainforests in Micronesia and is home to around 1,260 species. However, sea level rise is a big threat for the nation, and humans and animals alike are losing ground fast.
Earth.Org has mapped what extreme flooding could look like on Palau by 2100 as a call for global awareness.
—
Palau is the westernmost island cluster in the Caroline Island Group. 25% of the nation’s landmass lies below 10 m above sea level and only 12 out of 586 islands of the archipelago are continuously inhabitable, with roughly 180,000 citizens in total.
Low emissions projections by 2090 put sea level rise in Palau at 15 to 46 cm, medium emissions at 18 to 59 cm, and high emissions at 21 to 61 cm. Despite most of Palau standing 9 m above sea level, most of the high ground is hilly and thickly forested, unfavorable for human habitation and economic activity. Like most island states, Palau relies heavily on its coastline for its way of life.
Examples like the December 2008 floods that occurred from coastal flooding only (no downpour), highlight Palau’s vulnerability. It was a combination of the highest tide of the year, sea level rise and larger waves from a distant storm. Infrastructure was damaged, communities flooded and fresh water aquifers contaminated with salt. Approximately 60% of the island’s crops were destroyed. The probability of this kind of event occurring increases with each centimeter of sea level rise, becoming too costly to endure past a certain point.
The truth is that reversing the process is impossible, but mitigating it enough to give time to vulnerable countries and the rest of the world to adapt is key.
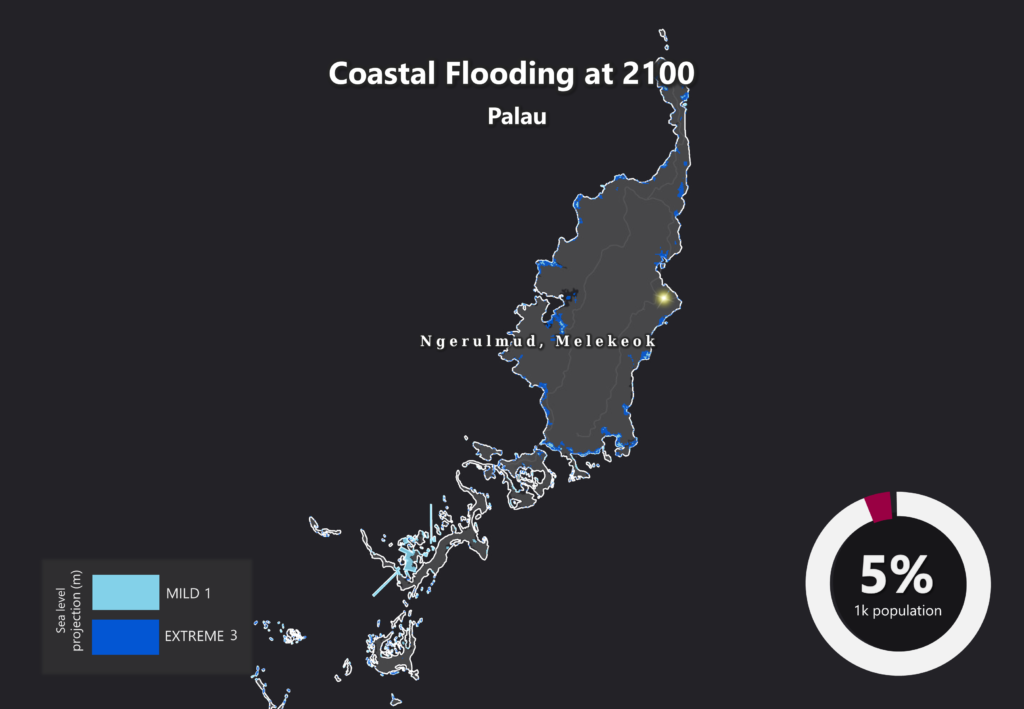
Earth.Org has modelled what a mild and extreme flooding event could look like in Palau by 2100 under a high emissions scenario to illustrate the need for action.

Sea level rise projections by 2100 for two scenarios with the amount of rise in meters indicated (mild = 1m; extreme = 3m). Population displacement indicated bottom right.
Methodology
Global mean sea level is projected to rise by 2m at the end of this century. However, in order to determine local sea level rise (SLR), one has to take into account local coastal flood levels which could be 2.8m above Mean Higher-High Water (MHHW) at extreme forecasts. These local levels bring variability to the projected SLR from 1m to 6.5m (eg. Rio vs Kolkata).
The SLR scenarios used in this study are based on the forecasts from Climate Central – Coastal Risk Screening Tool with the following parameters:
- Sea level Projection Source
- Coastal Flood Level
- Pollution Scenario
- Luck
Sea level Projection Source
From two highly cited journals by Kopp et al., estimating SLR mainly due to ocean thermal expansion and ice melt. The mid-range scenario projected 0.5-1.2m of SLR based on different representative concentration pathways (RCP) defined by the IPCC. While the pessimistic scenario added more mechanisms of ice-sheet melting, estimating SLR at 1m-2.5m in 2100, with a projection of 10m SLR at 2300.
Coastal Flooding
More frequent coastal flooding is a direct impact of sea-level rise. Based on the Global tides and surge reanalysis by Muis et al., (2016), it is estimated that the extreme coastal water level could be from 0.2 – 2.8m over the mean level. While in extreme cases like China and the Netherlands it could experience 5-10m of extreme sea levels. Here, the coastal local flood level is added on top of the projected SLR.
Pollution Scenario
Allows choosing the RCP, the greenhouse gas concentration trajectory defined by the IPCC. The mild level is based on RCP4.5, of 2°C temperature rise; while the Extreme level is based on RCP 8.5, of 4°C temperature rise.
Luck
Applies to the baseline SLR, defined in the “Sea level projection” section, upon which we add flooding. “Mild” refers to the mid-range scenario of 0.5-1.2m, and “extreme” to the pessimistic scenario of 1-2.5m. We used the high-end value of each scenario (mild = 1m; extreme = 2.5m).
Mapping and methodology by Braundt Lau. Article written by Wing Ki Leung and Owen Mulhern.
You might also like: Sea Level Rise by 2100 – Maldives
References:
-
Kulp, Scott A., and Benjamin H. Strauss. “New elevation data triple estimates of global vulnerability to sea-level rise and coastal flooding.” Nature communications 10.1 (2019): 1-12.
-
Florczyk, A. J., Corbane, C., Ehrlich, D., Freire, S., Kemper, T., Maffenini, L., Melchiorri, M., Politis, P., Schiavina, M., Sabo, F. & Zanchetta, L. (2019). GHSL Data Package 2019 Public Release.
-
Kopp, R. E., DeConto, R. M., Bader, D. A., Hay, C. C., Horton, R. M., Kulp, S., Oppenheimer, M., Pollard, D. & Strauss, B. H. (2017). Evolving Understanding of Antarctic Ice-Sheet Physics and Ambiguity in Probabilistic Sea-Level Projections. Earth’s Future, 5(12), 1217–1233.
-
Kopp, R. E., Horton, R. M., Little, C. M., Mitrovica, J. X., Oppenheimer, M., Rasmussen, D. J., Strauss, B. H. & Tebaldi, C. (2014). Probabilistic 21st and 22nd Century Sea-Level Projections at a Global Network of Tide-Gauge Sites. Earth’s Future, 2(8), 383–406.
-
Kulp, S. A. & Strauss, B. H. (2019). New Elevation Data Triple Estimates of Global Vulnerability to Sea-Level Rise and Coastal Flooding. Nature Communications, 10(1), 4844. Retrieved June 21, 2020, from http://www.nature.com/articles/s41467-019-12808-z
-
Muis, S., Verlaan, M., Winsemius, H. C., Aerts, J. C. J. H. & Ward, P. J. (2016). A Global Reanalysis of Storm Surges and Extreme Sea Levels. Nature Communications, 7.


![The Statistics of Biodiversity Loss [2020 WWF Report]](https://earth.org/wp-content/uploads/2020/12/lprwinkyTHB-544x306.jpg)


