

Despite sophisticated flood control infrastructure, large parts of the Zhuhai-Macau area are projected to be below sea level by 2100. Sea level rise of 65 centimeters, together with high tide, would flood 3400 km2 of the Zhuhai region.
Earth.Org has mapped what a severe flood would look like these two cities by 2100.
—
Situated at the southern tip of China, Zhuhai, and Macau generally have a humid subtropical climate with abundant rainfall. Recent rainfall extremes reached 482.8 millimeters over a single night in the port city of Zhuhai, causing flash floods and showcasing the region’s vulnerability to such events.
Extreme coastal flooding and intensified storm surges are the two main drivers of inundation, and sea level rise exacerbates both. Macau, built on a low-lying area, has become more vulnerable to coastal flooding in recent years. The 2018 Typhoon Mangkhut has led to severe flooding in the casino hub, forcing 1280 citizens to stay in temporary shelters. With newer estimates predicting a 1 to 2-meter increase in sea levels, Macau and Zhuhai officials urgently need to start planning an adaptation strategy.
As it is, their drainage systems are pushed to the limit. Zhuhai has a sewage outlet elevation of 1.24 meter, which is 10 centimeters lower than its local highest tide level. Over the total number of rainfall events in a year, Zhuhai needs sewage or flooding water drainage 11% of the time. Stagnant floodwaters have become a common problem, promoting mosquito proliferation.
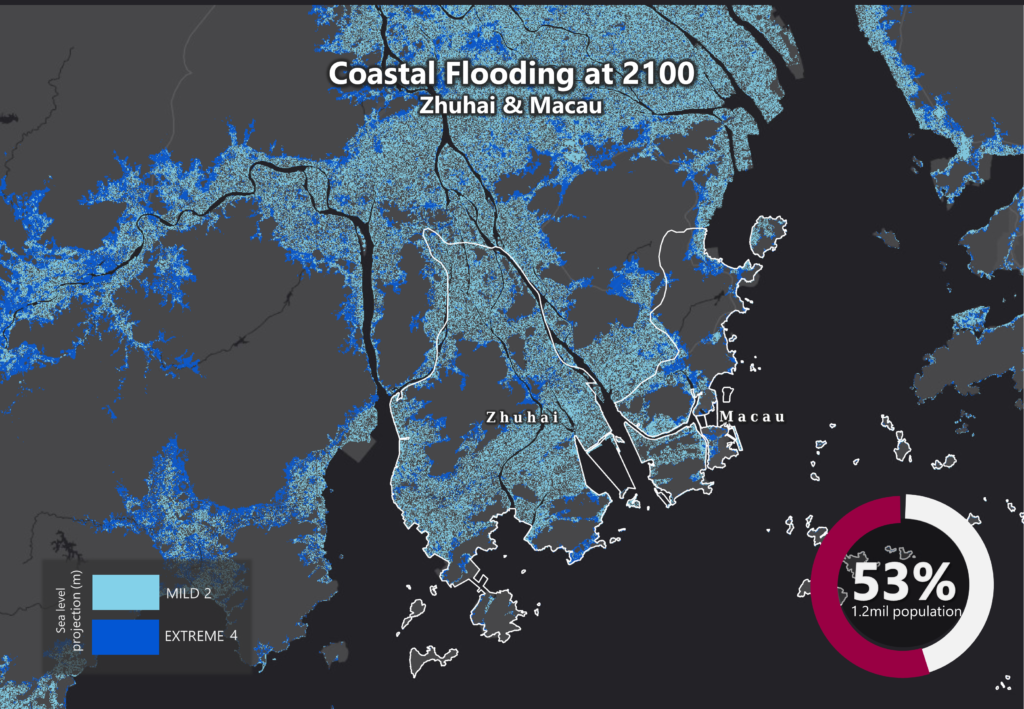
As a call to action, Earth.Org has mapped what extreme flooding could look like in Zhuhai and Macau by 2100.

Sea level rise projections by 2100 for two scenarios with the amount of rise in meters indicated (mild = 2m; extreme = 4m). Population displacement indicated bottom right.
Sea Level Rise Methodology
Global mean sea level is projected to rise by 2m at the end of this century. However, in order to determine local sea level rise (SLR), one has to take into account local coastal flood levels which could be 2.8m above Mean Higher-High Water (MHHW) at extreme forecasts. These local levels bring variability to the projected SLR from 1m to 6.5m (eg. Rio vs Kolkata).
The SLR scenarios used in this study are based on the forecasts from Climate Central – Coastal Risk Screening Tool with the following parameters:
- Sea level Projection Source
- Coastal Flood Level
- Pollution Scenario
- Luck
Sea level Projection Source
From two highly cited journals by Kopp et al., estimating SLR mainly due to ocean thermal expansion and ice melt. The mid-range scenario projected 0.5-1.2m of SLR based on different representative concentration pathways (RCP) defined by the IPCC. While the pessimistic scenario added more mechanisms of ice-sheet melting, estimating SLR at 1m-2.5m in 2100, with a projection of 10m SLR at 2300.
Coastal Flooding
More frequent coastal flooding is a direct impact of sea-level rise. Based on the Global tides and surge reanalysis by Muis et al., (2016), it is estimated that the extreme coastal water level could be from 0.2 – 2.8m over the mean level. While in extreme cases like China and the Netherlands it could experience 5-10m of extreme sea levels. Here, the coastal local flood level is added on top of the projected SLR.
Pollution Scenario
Allows choosing the RCP, the greenhouse gas concentration trajectory defined by the IPCC. The mild level is based on RCP4.5, of 2°C temperature rise; while the Extreme level is based on RCP 8.5, of 4°C temperature rise.
Luck
Applies to the baseline SLR, defined in the “Sea level projection” section, upon which we add flooding. “Mild” refers to the mid-range scenario of 0.5-1.2m, and “extreme” to the pessimistic scenario of 1-2.5m. We used the high-end value of each scenario (mild = 1m; extreme = 2.5m).
Mapping and methodology by Braundt Lau. Article written by Jennie Wong and Owen Mulhern.
You might also like: Sea Level Rise by 2100 – Fiji
References:
-
Kulp, Scott A., and Benjamin H. Strauss. “New elevation data triple estimates of global vulnerability to sea-level rise and coastal flooding.” Nature communications 10.1 (2019): 1-12.
-
Florczyk, A. J., Corbane, C., Ehrlich, D., Freire, S., Kemper, T., Maffenini, L., Melchiorri, M., Politis, P., Schiavina, M., Sabo, F. & Zanchetta, L. (2019). GHSL Data Package 2019 Public Release.
-
Kopp, R. E., DeConto, R. M., Bader, D. A., Hay, C. C., Horton, R. M., Kulp, S., Oppenheimer, M., Pollard, D. & Strauss, B. H. (2017). Evolving Understanding of Antarctic Ice-Sheet Physics and Ambiguity in Probabilistic Sea-Level Projections. Earth’s Future, 5(12), 1217–1233.
-
Kopp, R. E., Horton, R. M., Little, C. M., Mitrovica, J. X., Oppenheimer, M., Rasmussen, D. J., Strauss, B. H. & Tebaldi, C. (2014). Probabilistic 21st and 22nd Century Sea-Level Projections at a Global Network of Tide-Gauge Sites. Earth’s Future, 2(8), 383–406.
-
Kulp, S. A. & Strauss, B. H. (2019). New Elevation Data Triple Estimates of Global Vulnerability to Sea-Level Rise and Coastal Flooding. Nature Communications, 10(1), 4844. Retrieved June 21, 2020, from http://www.nature.com/articles/s41467-019-12808-z
-
Muis, S., Verlaan, M., Winsemius, H. C., Aerts, J. C. J. H. & Ward, P. J. (2016). A Global Reanalysis of Storm Surges and Extreme Sea Levels. Nature Communications, 7.


![The Statistics of Biodiversity Loss [2020 WWF Report]](https://earth.org/wp-content/uploads/2020/12/lprwinkyTHB-544x306.jpg)


