• This field is for validation purposes and should be left unchanged.
home_icon-01_outline
star
  • Earth.Org Newsletters

    Get focused newsletters especially designed to be concise and easy to digest

  • This field is for validation purposes and should be left unchanged.
Earth.Org PAST · PRESENT · FUTURE
Environmental News, Data Analysis, Research & Policy Solutions. Read Our Mission Statement

Air pollution is the third leading cause of death worldwide, and most large cities, have fine particulate matter (PM2.5) levels above WHO health guidelines. Here, we take a look air pollution mapping in Manhattan, NYC to better understand the current situation, and where things may be heading. 

After its colonization in the 1600s, New York City rapidly grew into an important trading port due to its strategic positioning. Many historic events took place in the area throughout the 1700s, until it was made the nation’s capital in the latter part of the century.  

The path was cleared for the city to prosper and expand, which indeed it did, growing from 60,000 to 3.43 million over the course of the 19th century.  

During the same period, the Industrial Revolution changed the world, bringing about better means of transportation, production and engineering, but also launching the exponential increase in fossil fuel emissions that we have not yet seen the end of. 

For the first hundred years of the United States’ existence, air pollution issues were settled by legal challenge between the concerned parties, with no specific legislation addressing the problem. It was around 1881 that the first legislation was enacted to specifically declare smoke emissions to be a public nuisance, after which municipal legislations began to multiply. 

Most of the smoke abatement ordinances of the time generally prohibited smoke vaguely defined as “dense”, “black” or “grey”, to a certain number of minutes per hour. The poor definition based on color led to a later definition of smoke density by Ringelmann Chart number or percent opacity.
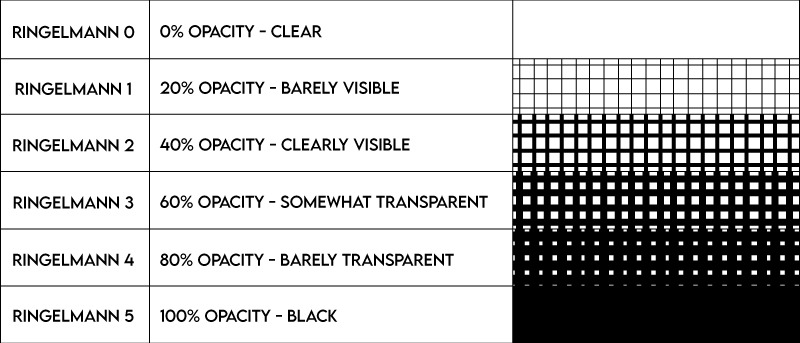
ringelmann opacity measurements smoke particles air pollution

Around the turn of the century, records show that it became unnecessary to state that air pollution was a public nuisance, as it was self-evident from the smell, soot, and irritated eyes and throats. County-level laws then came about in the 1920s, and the first comprehensive state legislation appeared in 1952, Oregon. 

stern air pollution legislation

Many of the laws included in the table above failed to make a difference because the appropriate oversight, personnel, and/or fiscal means to enforce them were not provided. In fact, most early air pollution measures were ineffective, regardless of the country, possibly due to the fact that it was written into law as a nuisance rather than a threat. Yet the nefarious effects of air pollution on health had been described since the 13th century, when air quality first dropped to abysmal levels in London.

Arthur C. Stern explains that, were it not for a few great men, little would have been accomplished, and he shares his personal hall of fame, included here for your perusal. 
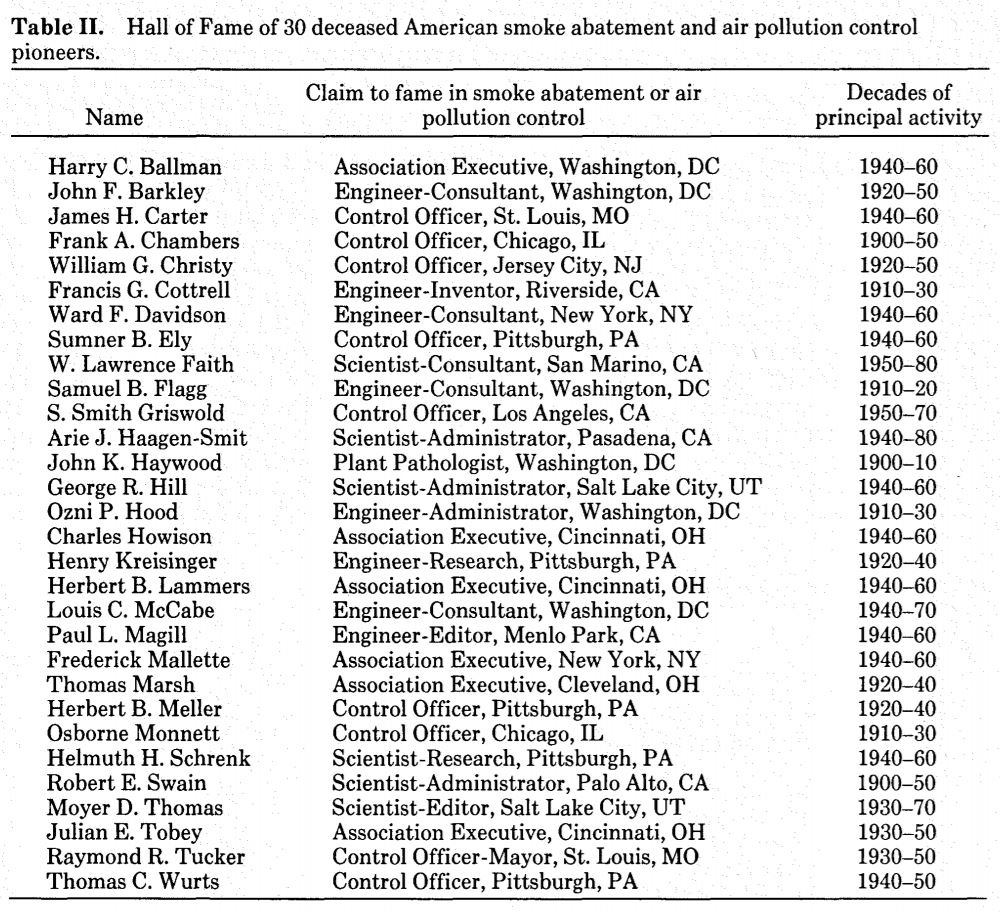
air pollution great men hall of fame

Real attention to air pollution in New York came about with the 1928 installation of Owens-type air paper air filters that captured fine particles. 

owens type air filters owens air filters

Set up in a number of key locations around the city, these provided much needed rudimentary data and gave way to a wave of studies. The main pollutant identified before World War II was sulphur dioxide (SO2) combined with soot from heavy coal combustion for heat and power production. This was addressed through the use of cleaner fuels (natural gas, better forms of coal, oil), higher smoke stacks and industrial gas cleaning in certain areas. However, the rise of the automobile replaced the SO2 with nitrogen dioxides and volatile organic compounds which can react in the air to create photochemical air pollution, the main component of smog. 

These became notorious in the late 40s and early 50s as a common occurrence in Los Angeles, and a rarer albeit deadly one in New York City. 

The first nation-wide piece of air pollution legislation, the Clean Air Act, came into play in 1963, meaning states could receive federal funds for their academic institutions, research programs and staff relating to air pollution. 

This Act set the foundation for the next major advances in air pollution regulation including the 1970 National Ambient Air Quality Standard (NAAQS), setting the first health-based limitations on six air pollutants, including:

A side note on lead: 

Lead was introduced as a way to boost fuel efficiency by permitting higher compression ratios, and was sold in the U.S. as a “tiger in the tank” of your car. After being criticized for its potential environmental damage, its noxious effect on human health was also demonstrated, and lead was slowly phased out of gas in the developed world. 

The Environmental Protection Agency took oversight of air pollution control and ushered in a new era of difficult, yet steady improvement in environmental policy. Some of the most notable changes were the use of catalytic converters to reduce carbon monoxide exhaust from cars and the change from ozone depleting chlorofluorocarbons to hydrofluorocarbons. 

More evidence emerged in the following decades proving the danger of even low levels of pollutants, from ozone to fine particulate matter, prompting the EPA to tighten its regulations on all of these. There are now 189 controlled threats on the list, all much better understood than before. 

new york city air pollution berkeley earth PM2.5

Source: Berkeley Earth.

Above, we see the long term PM2.5 levels recorded in New York City, courtesy of Berkeley Earth. The color ranges indicate the level of health risk associated with the PM2.5 according to the WHO’s guidelines, with 10 micrograms per meter cube being the recommended max. 

Using Berkeley Earth’s PM2.5 to cigarette equivalent in terms of health effects, we mapped air pollution over the city to give a more recent perspective on the situation. 
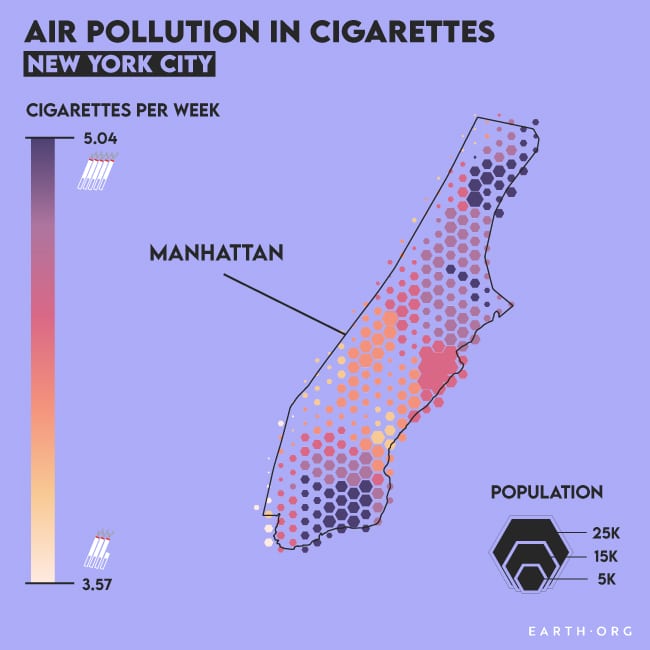
new york city air pollution pm2.5 berkeley earth cigarette equivalent

Air pollution mapping in Manhattan, NYC. PM2.5 data from NASA-SEDAC (2016).

New York’s air pollution remains above the WHO’s recommended limits, and the health effects amount to smoking 3 to 5 cigarettes per week for its citizens. Far from negligible, it is also far from infrequent – over 90% of all humans are exposed to air pollution levels over the guideline limit.

This data pre-dates the COVID-19 pandemic however, so current pollution levels are far lower, although they are expected to bounce back shortly after activity resumes since authorities are more concerned with getting the economy going again than saving what environmental progress was made. 

Not that they are wrong to do so; the pandemic hit New Yorkers hard, but it is a shame to see such environmental healing go to waste when we could use it to rethink how we do things. Of course, that would take more than a year and a half to implement. Things are already moving in the right direction, and the adoption of electric vehicles combined with cleaner energy is making a difference.

This article was written by Owen Mulhern.

You might also like: The History of Air Pollution in Johannesburg


Air pollution is the third leading cause of death worldwide, and most large cities, have fine particulate matter (PM2.5) levels above WHO health guidelines. Here, we take a look air pollution mapping in Johannesburg to better understand the current situation, and where things may be heading. 

Air pollution is tightly linked to a country or city’s stage of economic development, so it is helpful to take a look back at its history to understand why things are as they are today. 

In the late 19th century, South Africa transformed from what was mainly an agricultural society to an industrialized one. Entrepreneurs of the time capitalized on the massive mineral reserves of the region, diamonds and gold in particular. 

Johannesburg was founded as a mining camp of about 3,000 people in 1887, but the gold rush caused it to grow to a town of 100,00 within ten years, then to a city of a quarter million by 1914. Labour force demand was the driving force behind all of this, leading to an extraordinarily compacted, uneven development of the city. Quoted as a place, “of unbridled squander and unfathomable squalor,” large parts of its population found themselves pressured to get by in this runaway urban society. 

The main difference between the pre- and post-industrialized society was the new presence of mass production and huge factories. No matter where these appeared, records remain of the fetid smoke belched out the chimneys and difficult working hours, returning home covered in grease and soot. 

South Africa’s industry developed later than other countries’, lagging behind England and even Australia, but the result was similar: coal and chemical fume-spouting chimneys popped up everywhere. 

In its early centuries, the environmental issues of most concern were drinking water control and rationing, water and land pollution and the conservation of wild animals. This last one became a big issue in the late 19th and early 20th, while air pollution remained largely ignored. 

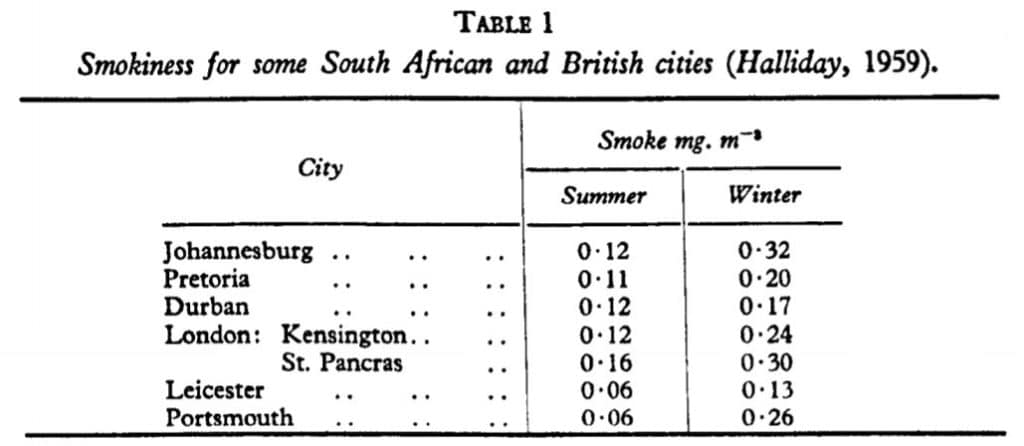
Global concern arose with the London disaster of 1952, where thousands died within days after meteorological conditions created a dense blanket of toxic smog over the city. This prompted many to speak out, and a wave of rudimentary studies appeared. One by P.D. Tyson, published in 1959, cites concerns about South African cities’ “smokiness” being as bad, if not worse than that of British cities. With no differentiation of the types of particles, they measured air pollution in units of actual smoke. 

south africa johannesburg UK air pollution in smoke units

Source: P.D. Tyson (1959).

As you can see, Johannesburg was already one of the most polluted cities of the industrialized world, especially in winter. 

As a sidebar: this is an important aspect of atmospheric pollution in general; meteorological conditions will largely dictate whether particles stagnate or get blown away, though of course their amount is also a deciding factor. 

Back to Johannesburg, the problem of air pollution was visible, yet governmental inaction persisted. This could be chalked up to the lack of information on the health impacts of noxious fumes. This data was the missing link between pollution and the constitutional right to a safe environment. 

A few years later, the Atmospheric Pollution Prevention Act of 1965 was the first legislation of its kind in South Africa, though unfortunately it was a largely ineffective piece of legislation. The situation didn’t truly change until 1996 (30 years later!), when section 24 of the South African Constitution robustly enshrined basic environmental rights for its citizens. The National Environmental Management Act (NEMA) came soon after, along with the ratification of the United Nations Framework Convention on Climate Change (UNFCCC). 

Things were finally moving on a global scale, though South Africans still had to wait until 2004 for the Air Quality Act to come into play, setting precise national norms and standards to regulate air quality. Namely, the particles falling under regulation were sulfur dioxide (SO2), nitrogen dioxide (NO2), particulate matter (PM10), fine particulate matter (PM2.5), ozone (O3), benzene (C6H6), lead (Pb), and carbon monoxide (CO).

A few or many of these may be familiar to you, but here we focus on PM2.5, the notoriously small particles that can enter deep into the lungs. They have similar health effects to those of smoking, including but not limited to chronic bronchitis, reduced lung function, cancer and heart disease. Berkeley Earth, a climate-concerned think tank, made a conversion formula from PM2.5 to cigarettes in terms of health effects, which we mapped below.

air pollution in Johannesburg
Air pollution mapping in Johannesburg. PM2.5 data from NASA-SEDAC (2016).

PM2.5 air pollution in Johannesburg is, on average, as bad for you as smoking 12 to 14 cigarettes a week. If you think that sounds like a lot, that’s because it is. Most large cities in  developed countries have dropped the cigarette index to under 3 a week, many in Europe under 1. 
The truth is that Johannesburg’s air quality is lagging behind that of its peers, and its citizens are suffering the consequences. According to a 2019 study, air pollution shaves an average 3 years off the Johannesburger’s life. The combination of vehicle emissions, coal-heavy energy production and forest fires create a serious health hazard which South Africa doesn’t seem ready to take care of. 

Policy is filled with glaring omissions like the lack of a vehicle emissions standard; truly a standard nowadays when they are found from Europe to India. A 2019 study estimated a single energy company called Eskom was responsible for over 300 deaths a year in an industrial zone near Johannesburg, prompting a lawsuit against the government. It is still ongoing today, and little progress has been made. 

South Africa isn’t doing enough to curb its air pollution, but clean technology is becoming more market-competitive everyday and it will soon be the economically preferable choice to improve things. In the meantime, the authorities are racking up a debt with their citizens that cannot truly be repaid, though reparation is certainly due. 

This article was written by Owen Mulhern.

You might also like: Melbourne Air Pollution


Air pollution is the third leading cause of death worldwide, and most large cities, have fine particulate matter (PM2.5) levels above WHO health guidelines. Here, we take a look air pollution mapping in Melbourne to better understand the current situation, and where things may be heading. 

In the early years of the industrial revolution, essentially during the length of the 19th century, air pollution in most countries came from coal-spouting chimneys and a vile mix of noxious odors from factories. 

During this time, Melbourne went from a small settlement, acquired from aboriginal peoples by a business syndicate, to the full-fledged capital city of Australia, though only for a short time. The 1870’s were a mini golden age with a 20+ year economic boom during which it was dubbed “Marvellous Melbourne”. The population grew from 280,000 to 445,000 in the 1880-1890 decade and it gained the reputation of the richest city in the world. It certainly was one of the largest, with a typical American-Australian suburban sprawl, granting to each their “promised quarter-acre” of the time. 

Of course, rapid urban expansion came hand in hand with increased levels of pollution, including fouled waterways, streets and air. Some of the most illustrative records of Australian urban air pollution at the time come from local poetry. Andrew “Banjo” Peterson’s 1888 Clancy of the Overflow put it so:

I am sitting in my dingy little office, where a stingy

Ray of sunlight struggles feebly down between the houses tall, 

And the foetid air and gritty of the dusty, dirty city

Through the open window floating, spreads its foulness over all

He was writing about Sydney, but Melbourne, spearheading Australian industrial development at the time, was in similar conditions. 

The earliest action against air pollution in the country were Health Acts like the Smoke Nuisance Abatement Act in 1902 in New South Wales, which was quickly mirrored by similar provisions in most Australian States. It was mostly ineffective however, as records show little to no proceedings based on the act in the following decades. Better provisions came later, such as one placing a limit of three minutes of thick smoke emissions per half hour, leading to many successful prosecutions, but still not much change. 

Overall, little action was taken against air pollution until the London disaster of 1952, during which an ominous smog blanketed the city and caused around 4000 deaths within a few days. This was a wakeup call for many large cities around the world, where pollution had been obvious but solving it was not a priority.  

On the 1st May 1957, the Honourable Buckley Machin introduced the first specific air pollution legislation (rather than Health Acts), citing concerns shared by a physician friend who was alarmed at the apparent link between cancer and air pollution. Quoting his friend to King George VI in a letter, he said: “Lung Cancer is predominantly a disease of the city and urban dweller.” The reports went on to blame Melbourne’s power stations for the terrible conditions of those living around it, citing homes covered in soot and dead gardens.

With increasing evidence of unacceptable levels of pollution thanks to a growing number of measurements, the state of New South Wales passed the Clean Air Act in 1961. It enforced the use of the “best practicable means” for preventing air pollution, giving it quite some scope. Contemporary practices of “dilution is the solution to pollution”, like tall smoke stacks, were not good enough anymore. It still took years before truly effective technologies enabled cleaner production and reduced pollution at the source, but this was the beginning of true change in Australia’s air quality. 

Motor vehicles were also growing in numbers around this time, as was the awareness of their nefarious carbon monoxide emissions. Surprisingly, they were considered more of a nuisance than a danger to public health, so no further action was taken, a strange conclusion to reach considering the way things were going. Unfortunately, while progress was made in regulating industrial emissions, monitoring techniques in the 1970s proved completely inadequate in identifying the growing problem of vehicle pollution. 

A big shift in how air pollution was monitored came with the Environment Protection Authority’s (EPA) commitment to high-standard monitoring in 1973. From then on, more effort was put into developing and standardizing measurement techniques, equipment and scheduling around the country. This gave way to major air pollution studies, of which many were around Melbourne, characterizing its meteorological nature, and how ozone, smog and particulate haze behaved in it. With better evidence, it is easier to drive policy in an informed direction, so it isn’t surprising that more decisive legislation followed, of which here are a few: 


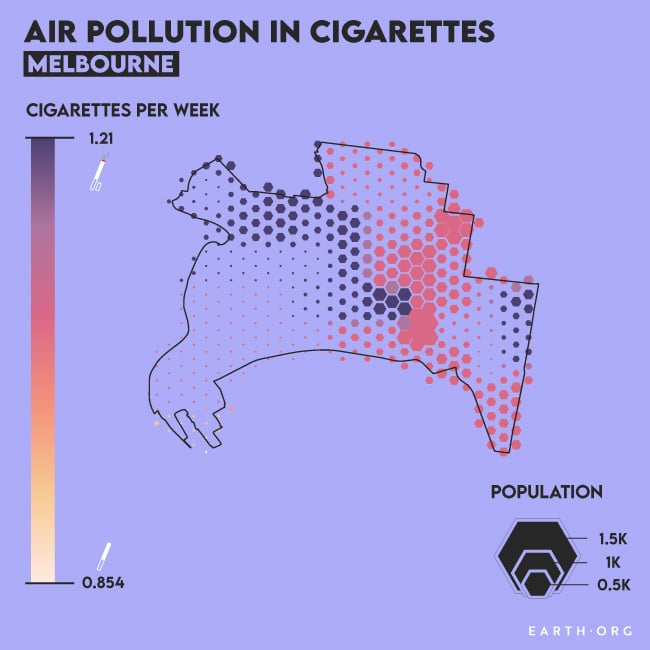
The EPA’s continued monitoring since the 1970s shows that carbon monoxide, nitrogen dioxide and sulfur dioxide have decreased significantly, but ozone and particulate matter remain problematic depending on the time of year. With this, the public health burden is greatly reduced, as fine particulate matter  (PM2.5) has many similarities to cigarette smoke in terms of health effects. Using the most recent census data, and Berkeley Earth’s PM2.5 to cigarette equivalence in terms of health effects, we mapped what air pollution looks like in Melbourne to give you a better picture of the situation. 

melbourne air pollution cigarettes equivalent fine particulate matter pm2.5

Air pollution mapping in Melbourne. PM2.5 data from NASA-SEDAC (2016).

What you see above is a very low average yearly pollution compared to most large cities in the world. Some of the key reasons for this are decades of attention to industrial emissions and a relatively early shift to natural gas thanks to the 1973 coal crisis, followed by low population density, meaning less cars. When compared to the heavily polluted Delhi’s ~11,000 inhabitants per kilometer square, Melbourne’s 1,500 makes it much easier to avoid congestion. 

Cities with higher population density and unfortunate meteorological conditions have a taller task ahead of them to solve air pollution, and it will only come from a combination of better urban planning, public transport and cleaner energy sources. 


This article was written by Owen Mulhern.

You might also like: Delhi Air Pollution

Air pollution is the third leading cause of death worldwide, and most large cities, Delhi included, have fine particulate matter (PM2.5) levels above WHO health guidelines. Here, we take a look air pollution mapping in the Delhi metropolis to better understand the current situation, and where things may be heading. 

Air pollution’s origins are tightly linked to the history of industrialization, so I’ll start this article off by giving you a brief review of India’s. It began back in 1854 when the first cotton mill venture was launched, followed shortly after by the first jute mill in Calcutta. Large-scale industry accounted for 7% of national income along with mining, employing only 3.5 million (or 2.5% of the total workforce), while agriculture employed over 70%. Development was slow, and cotton and jute remained the two main industries for decades, overshadowing the infant-industries of paper, sugar, cement and steel. How these industries performed was entirely dependent on the state of the global economy; in the early 20th century, economic boom conditions increased domestic income, public revenue and public spending. Conversely, the first world war, its ensuing agricultural crisis and the Great Depression caused a crisis in India. 

After a few more ups and downs, decisive action was taken to expand industry during the post-second world war years. This resulted in a 7% annual growth rate between 1951 and 1965, a rate higher than anything recorded over such a period of time.

Naturally, with industry comes pollution, and India began to noticeably degrade its air quality around this time. But India as we know it today is one of the most polluted countries on earth, with 5 of the 10 most polluted cities in the world; so how did it get this bad? It seems to be correlated to population size and urban population growth rates. 

Oftentimes, excessive air pollution speaks of governance failures, unable to enforce legislation for pollutant control and public transportation alternatives. Delhi, however, boasts an excellent train system and fuel standards to rival those of the EU. Unfortunately, as the population continues to explode (from ~16.7 million in 2011 to 20 million in 2019), so does the car fleet, now standing at 10 million registered vehicles. The resulting traffic congestion is atrocious, despite odd-even regulation, where certain days in the week are reserved for odd license plates and vice-versa.

Delhi is experiencing a boom in construction, which benefits from little dust and emissions control, to which episodic landfill fires add their emissions, despite their official shutdown in 2009. Yet authorities place the blame on something else entirely: crop burning (below, Delhi Chief Minister tweeting about the issue).


Indeed, farmers of the nearby Punjab and Haryana region need to burn crop stubble after harvest, rapidly freeing up their land for sowing their winter crops before it is too late. The fumes are carried over Delhi where the air often stagnates due to geographical and meteorological factors, forming a blanket of heavily polluted air. When we say heavily, we mean polluted beyond the highest categorized levels of pollution. 

Delhi air pollution cigarettes berkeley earth

Pm2.5 air pollution daily averages from May 2016 to Early 2021. Source: Berkeley Earth.

Stubble burning usually occurs in November which coincides with the wild peaks you see in the graph above. Of course, these are short-lived while transportation, industry, open waste burning and road dust keep the levels within the unhealthy (red) to hazardous (purple) range most of the time. 

What does this translate to in health terms? As you can see above, Berkeley Earth uses an interesting analogy for air pollution, converting fine particulate matter’s (PM2.5) effect into cigarettes smoked. We used this data to make a map of Delhi’s density and PM2.5 exposure in 2016 (latest available PM2.5 data), which remains relevant because not much has changed in the last 4 years. 

Earth.Org air pollution cigarette equivalent PM2.5 particulate matter Delhi New Delhi

Air pollution mapping in Delhi. PM2.5 data from NASA-SEDAC (2016).

At best, people in Delhi breathe enough air pollution to cause the same detrimental effects as 31 cigarettes per week, when averaged over a year. Further, the worst of the pollution occurs in the most densely populated areas. The situation is unacceptably dangerous and it is incumbent on authorities to take the necessary measures and fix it; but what would those be? 

It wasn’t long ago that the region lacked sustenance to the point it relied on food aid from neighboring regions. Green revolution methods allowed farmers to achieve food surplus in the 1970s, but this came with excessive groundwater drainage which had to be regulated. Laws forcing farmers to wait until monsoon rains to plant certain crops left them with little time to go from summer to winter crops as mentioned earlier, hence the necessary crop burning. 

On the other hand, India’s development, while fast, is far from ready to solve its traffic crisis. The public transportation network is flourishing, but lacks the capacity needed to accommodate 20 million people. To illustrate, Delhi is 14 times the size of Paris, yet has only twice its metro length.

Much can still be done, and many blame officials for their lack of urgency. Energy comes mainly from coal, and the region has made little headway on the conversion to renewables. Air quality monitoring is poor, and a dearth of information encourages apathetic responses. The situation is clearly bad enough to warrant stronger incentives or regulations for reduced vehicle usage, yet nothing of the sort has come up. It will take a concerted effort by the local government to redirect time and resources toward solving the pollution problem at the cost of short-term productivity and profit. In the long run however, the improved quality of life will pay this back two-fold, as reduced disease burden, better circulation and sustainable energy options will ensure a bright future for the city. 


This article was written by Owen Mulhern. 

You might also like: 30 Years in a Day: We Can Now Detect Climate Change From a Single Day’s Data


Air pollution is the third leading cause of death worldwide, and most large cities, Shanghai included, have fine particulate matter (PM2.5) levels above WHO health guidelines. Here, we take a look air pollution mapping in the Shanghai metropolis to better understand the current situation, and where things may be heading. 

Since China’s economic reform from a centralized, isolated economy to the open market in 1979, it has been the world’s fastest growing economy, with GDP growth averaging 9.5% through 2018 (now a little under 7% a year). Urbanization accelerated in similar fashion during this period; the proportion of urban population rose from 18% in 1978 to 59% in 2018, totaling 820 million people, well over twice the current US population. 

NASA’s Landsat satellites capture the astounding expansion of the Shanghai megalopolis in the images below.

Shanghai Megalopolis 1980 NASA landsat

NASA Landsat composite image of the Shanghai Megalopolis, using shots from 1984 to 1988.


Shanghai Megalopolis NASA Landsat 2010s

NASA Landsat composite image of the Shanghai Megalopolis, using shots from 2013 to 2017.

This sprawling agglomeration covers over 7000 square kilometers, which is ~7 times the size of Hong Kong. The striking loss of greenery (mainly cropland) came with degraded water quality, contaminated soil, insufficient housing and sanitation, traffic congestion, local climate alterations and air pollution. Let’s take a closer look at this last one; below is Shanghai air quality data from 1980 to 2005. 

shanghai air quality data

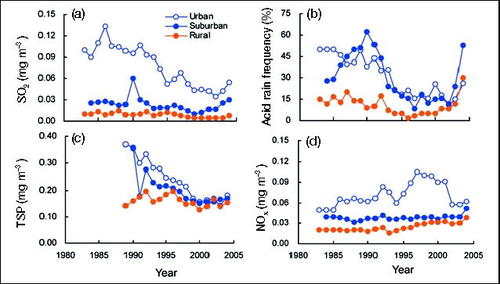
Changes in (A) sulfur dioxide (SO2); (b) acid rain frequency; © total suspended particles (TSP); (d) nitrous oxides (NOx). Source: Zhao et al. 2006.

We see high levels of sulfur dioxide (SO2; top left) and total suspended particles (TSP, equivalent to particulate matter, bottom left) throughout the 80s and early 90s. These both mainly came from coal combustion, which was by far the worst source of pollution at the time. This, combined with poor water quality and sewage systems had noticeable effects on health and well-being, leading to public concern. Local authorities rapidly took successful measures to reduce domestic and industrial coal consumption, reflected by the gradual drop in SO2 and TSP between 1980 and 2000. While this was happening, motorized vehicles became more accessible and multiplied by 2000%, leading to an increase in nitrous oxide levels.

There is a tight link between environmental degradation and economic development, and the latter was given priority in 20th Century China. Still, regulatory bodies, a national air pollution monitoring system and pollution control research and development were implemented in the 90s, but failed to make a real difference. According to The Lancet Planetary Health, the average PM2.5 exposure in China only dropped by 9% from 57.8 to 52.7 ????g / m3 between 1990 and 2017. Shanghai’s worst air pollution episode may have been during the 2013 Eastern China smog, when dangerously high levels of fine particulate matter blanketed the city. Readings crossed the 300 ????g / m3 mark on December 2nd; for comparison, the recommended WHO guideline is 10 ????g / m3

Around this time, multiple studies began assessing the amount of excess deaths due to air pollution in China, along with the economic losses it incurred (which topped US$ 1 billion per year). The Chinese government finally took decisive action and unveiled the US$ 284.2 billion “Airborne Pollution Prevention and Control Action Plan”, specifying targets for PM2.5 reduction by region for 2017, Greater Shanghai’s being 20%.

YRD yangtze river delta shanghai air quality over time

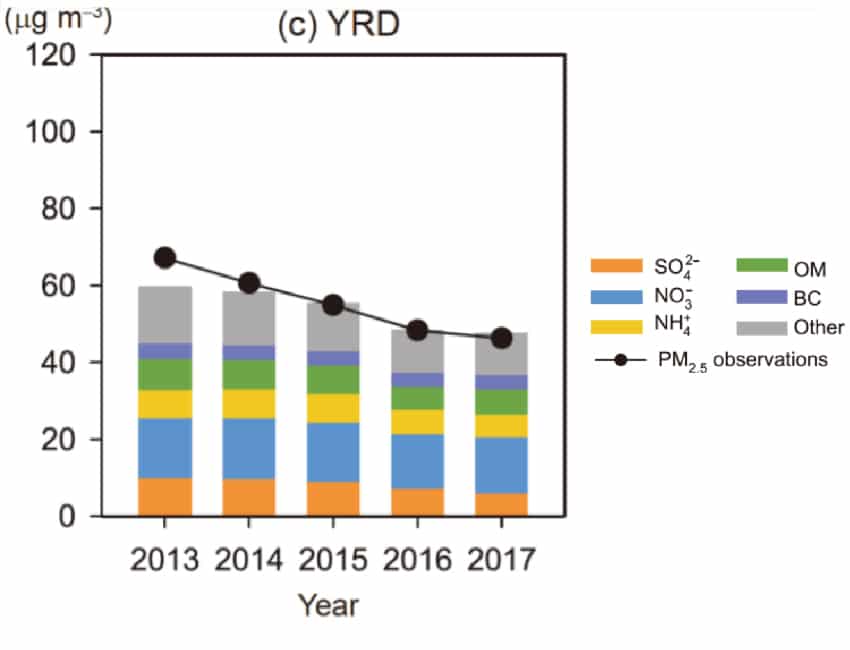
Air quality in the Yangtze River Delta (YRD; where Shanghai is located) over time. Source: Geng et al. (2019)

As you can see above, PM2.5 levels (black line) did indeed drop about 20%, indicating a successful campaign. Having met its goals, China did not relent: it released its second national air pollution action plan, known as the Blue Sky Action Plan, in 2018. Rather than focus on key regions, this plan sets targets for the entire nation, requiring all agglomerations to reduce their PM2.5 by 18% by 2020, using 2015 as a base year.  

Shanghai had already reduced air pollution 26% below 2015 levels by 2016, yet local authorities continued their efforts.The local government released the draft of a master plan for 2040 in 2017, calling for PM2.5 to be reduced to about 20 ????g / m3. In the meantime, the city has been exceeding targets for the past five years, now standing at an average 35 ????g / m3, finally meeting international standards. Emission control measures for industry, combined with steady reductions in coal use and cleaner car technologies are to thank for their improvements. 

It must be said, however, that 20 ????g / m3 remains harmful to our health. The WHO explains that anything above 10 ????g / m3 will effectively increase our chances of respiratory and cardiovascular diseases.

Shanghai air pollution pm2.5 to cigarette health effect equivalent berkeley earth

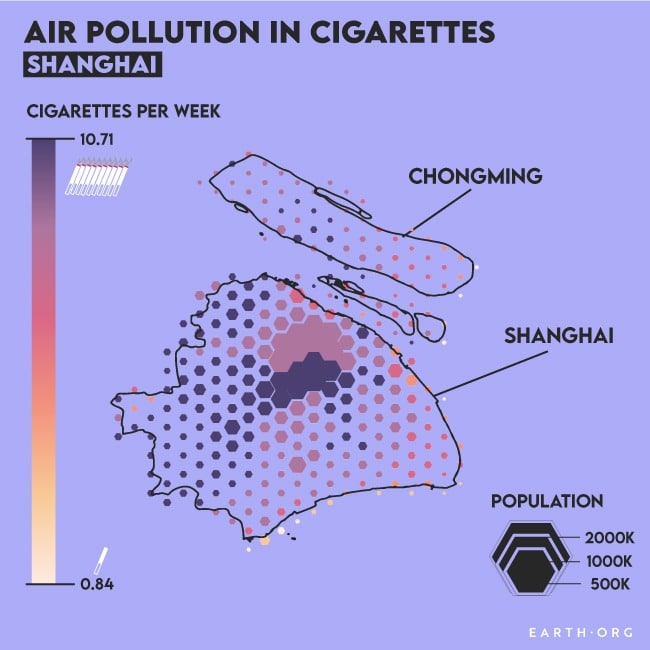
Unfortunately, it seems that even the best efforts of a fully developed country aren’t enough to eliminate the problem. Because the health effects are akin to those of cigarettes, we used Berkeley Earth’s air pollution to cigarette equivalence to illustrate Shanghai air pollution a little differently. 


This article was written by Owen Mulhern.

You might also like: Shifting Baselines and the Elusiveness of Climate Change


References

Air pollution is the third leading cause of death worldwide, and most large cities, London included, have fine particulate matter (PM2.5) levels above WHO health guidelines. Here, we take a look air pollution mapping in London to better understand the current situation, and where things may be heading. 

The first energy crisis occurred in 16th Century England, when wood was still the standard material utilized in buildings, transportation, tools and heating. Forests cover had already been reduced to about 7% of total land area, and rapid urban expansion, especially around London, was causing shortages. Indeed, the capital’s population “multiplied at least eightfold, from some 60,000 in 1534 to some 530,000 in 1696”, writes John U. Nef, a 20th century economic historian. 

Coal had been burned in London since the beginning of the 13th century, pushing Eleanor d’Aquitaine to log the earliest known complaint against its fumes in 1257. The ore had been used by humans for a couple thousand years at this point, notably in China 3 thousand years prior to our day. Different societies used it at their own rates, but it did not become a global staple until England fully adopted it to solve its deforestation crisis between 1550 and 1700, eventually leading to the Industrial Revolution. 

One of the earliest known works on air pollution was a pamphlet published in London in 1661 called the Fumifugium, or The inconveniencie of the aer and smoak of London dissipated together with some remedies  humbly proposed by J.E. esq. To His Sacred Majestie, and to the Parliament now assembled. If you can still breathe after reading that out loud, you probably come from an area with low air pollution. Jokes aside, it rightly accused coal of poisoning the air, proposed that wood would be a healthier option, and recommended that polluting industries be moved outside the capital. 

Scholars of the newly formed Royal Society were quick to praise the pamphlet, but it gained no traction among policymakers. Nonetheless, it reflected a growing awareness on the issue of air pollution in a society unschooled in environmental issues as we are today. Lines were being drawn between air pollution and London’s higher mortality rates, lower plant diversity, and visibly accumulating particulate matter. London’s fog was notorious, known to halt railway journeys, economic activity and encourage rampant crime. The city as a whole experienced 80 dense fog days per year, but depending on the area, with the record high standing at 180 in 1885. 

Indeed, complaints about fog are as old as the city’s coal usage, but a lack of rural data made it difficult to prove fog days were multiplying. Many years later, we have a reconstruction of London’s air pollution levels through time based on an economic analysis (Fouquet, 2011).

air pollution London delhi

From a peak that stands above that of Delhi 4 years ago, the beginning of London’s air pollution decline coincides with the UK’s 1891 Public Health Act, under which excessive smoke emissions could encounter financial penalties if efforts weren’t made to adopt cleaner practices. This began the century-long decarbonization movement in London, with industries shifting to less polluting forms of coal, while heating and cooking largely switched from coal to gas.

More recently, air pollution was marked by the implementation of the congestion charge in 2003, which came about after London’s officials visited Singapore and witnessed its Electronic Road Pricing system. Charging vehicles within a large perimeter around the center, traffic was notably reduced, dropping fine particulate matter (PM2.5) with it. 

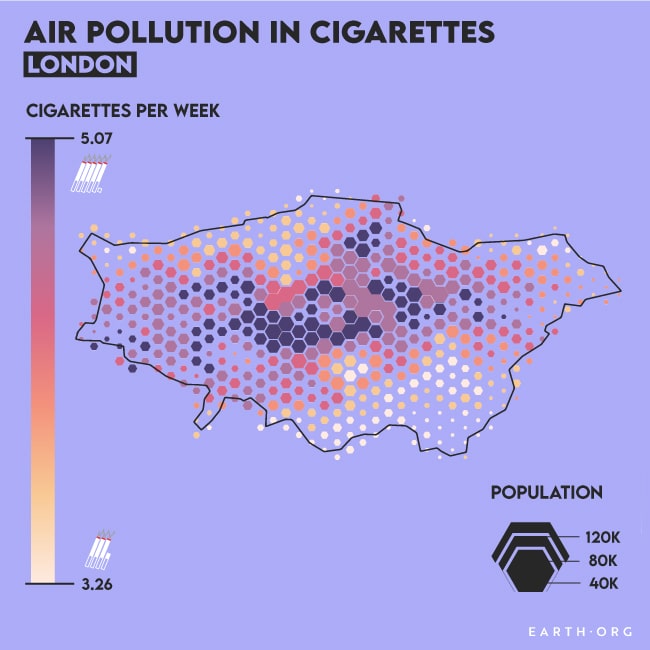
Now, with the most recent PM2.5 data (from 2016), and using Berkeley Earth’s PM2.5 to cigarette equivalent, we mapped the cigarettes smoked per week across London.

air pollution PM2.5 fine particulate matter London cigarettes equivalent Berkeley Earth

Air pollution mapping in London. PM2.5 data from NASA-SEDAC (2016).

As we can see, the entirety of London’s population was breathing in an equivalent of 3 to 5 cigarettes per week (~15 ????g / m3) from pollution in 2016. This puts the entire city above the WHO guideline PM2.5 concentration, which did not go unnoticed by the authorities. 

WHO pm2.5 guidelines

Sadiq Khan entered mayoral office in 2016, when his constituents were suffering ~9,000 premature deaths per year due to air pollution. A year later, London was the first world megacity to sign up the WHO’s “Breathe Life” campaign, whose signees commit to meet the WHO guidelines for PM2.5 by 2030.

Interestingly, much of the city’s PM2.5 comes from regional and even transnational sources; even in 2016, its own background level was already as low as 10.2 ????g / m3. Still, tackling road emissions by electrifying the vehicle fleet, and improving pedestrian, cycling and public transport options would greatly reduce PM2.5. 

As of early 2021, inner London emissions are on the decline, partly thanks to the inauguration of the ultralow emission zone, which charges a daily fee to vehicles based on their emissions profile. 

An important takeaway here is that all large cities went through periods of extreme pollution as they developed, which means that high pollution areas today are so because it is practically unavoidable. This also means that there will be much more to come, especially in Africa, and it could benefit us all to speed up renewables’ rise as the most cost-efficient option. 

This article was written by Owen Mulhern.

You might also like: Air Pollution in Paris


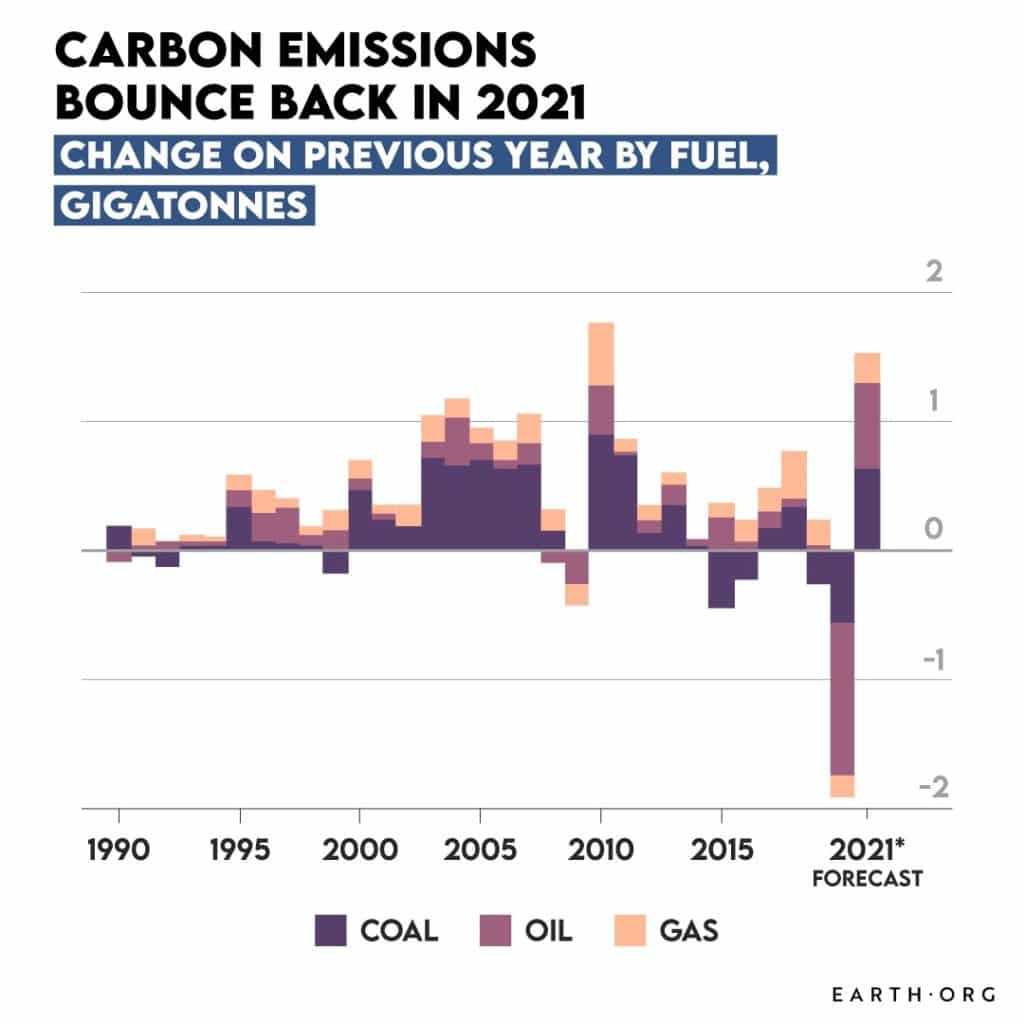
While a disaster, the COVID-19 pandemic massively reduced energy demand, and thus global emissions. Some hoped we could use this chance to turn over a new leaf and steer our society into a more sustainable course; unfortunately the IEA’s expects global emissions to bounce back in 2021.

Earth.Org takes a closer look. 

The COVID-19 Pandemic was the single most disruptive event to affect human society since World War II. Nonetheless, amid lockdowns, proliferating infections and deaths, all were quick to notice the sudden drop in pollution as activity grinded to halt. It seemed that the pandemic’s silver lining was a huge decline in our greenhouse gas emissions, at a time when wildfires, sea level rise and ice melt all began hitting record rates. 

Global carbon emissions dropped by 6.4% in 2020, thanks to reduced demand for energy from all sources. Interestingly, we need to make similar cuts each year for the next decade if we are to remain under 1.5°C global warming. 

carbon cuts 2020, emissions 2021

Any hope that COVID-19’s disruption would help us adjust course and emerge with a more sustainable global profile was dashed by the IEA’s latest energy review.  As global economic activity surpasses 2019 levels in early 2021, global energy-related emissions are expected to increase by 5%, bringing within arm’s reach of pre-crisis levels.

  carbon emissions bounceback 2021 change in global energy related emissions

The oil industry, which saw its biggest annual decline ever in 2020, is expected to produce emissions surpassing those of coal in 2021, though this would still only recover the demand lost in 2020. This partial recovery is quite simply due to the pandemic not being over, and restrictions still in place on transportation, making for a sluggish aviation rebound. 

Coal use is projected to come back with a vengeance in 2021, surpassing 2019 levels by 0.4% and falling just short of the 2014 global peak. The Chinese coal power fleet represents one third of global consumption and its energy demand is rising rapidly. Its usage of all fossil fuels is expected to grow with coal contributing 70% of the increase. Painting a nuanced picture, China is both exemplary in its renewable infrastructure development, and reprimandable for its 7% increase in coal output between 2019 and 2020. 

India is set to show similar behaviour, while US coal consumption will remain 5.6% below 2019 levels while natural gas and renewables continue to carve out more space for themselves. 

The pandemic success story in the energy sector is renewables; these continued their growth through 2020 thanks to a 7% growth in electricity generation from renewable sources. Recent long-term contracts and priority access to the grid overcame lower electricity demand, supply chain challenges and construction delays. The IEA predicts record growth rates in 2021, with half the global increase coming from China, followed by the US, the EU and India. Wind leads the charge, as policy deadlines in China and the US drove developers to make a record amount of installations in the 4th quarter of 2020. 

On conclusion, it seems that 2020 will hardly put a dent in the past two decades’ global emissions trend. However, it gave renewables a chance to carve out a little more space in energy generation, hopefully accelerating its race to the top. It remains a shame that we could not capitalize more on this crisis to reform our energy source profile as a global community, but it is also too optimistic to think that this could be figured out in a year with so much turmoil. 

This article was written by Owen Mulhern.

You might also like: Shifting Baselines and the Elusiveness of Climate Change

The global climate has been warming for several decades, yet we have been slow to react. This is largely due to the fact that individuals rarely witness changes in weather patterns, or the broader consequences of our actions as a species for themselves. This phenomenon was dubbed the shifting baselines syndrome, and is an important factor in our inability to deal with climate change.

Earth.Org takes a closer look.

One of the main issues with raising awareness about climate change is that few notice its effect year by year. This is to be expected, as climatological changes occur over time periods that are meant to dwarf the human lifespan, on top of which, we’ve been in an unusually stable and benign climate for the past 12,000 years. Nonetheless, scientific evidence puts climate change certainty above 95% (according to the last IPCC report), so why can’t we put a finger on it?

It is likely due to a phenomenon called the “shifting baselines syndrome”. The term was coined by Daniel Pauly in 1995, when describing the declining size of fish and total catch that had somehow gone unnoticed for generations. Fishermen, when asked, would claim that fish yields had “always been so”, despite records pointing to the contrary, demonstrating a sort of “environmental generational amnesia”. The very gradual changes in our environment combined with each person accepting the world they are born into as the norm results in a lack of shock at historical changes beyond their lifetimes. 

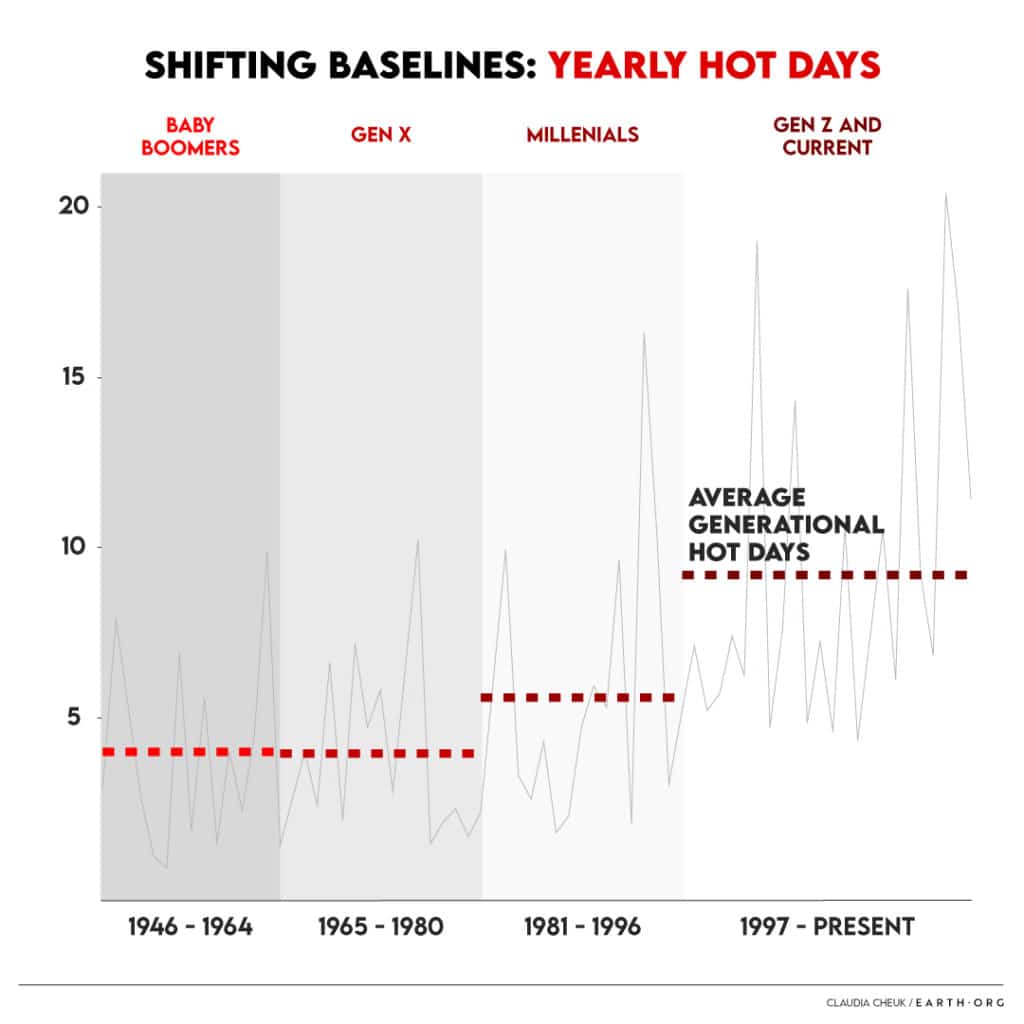
In order to demonstrate this effect, we gathered data from the German weather service to look at the evolution of a few simple types of climate-driven patterns since 1946, i.e. hot days per year. We defined hot days as those with a maximum temperature of 30.0 °C or more, which on average used to occur around 4 times a year in Germany back in the 1950s. 

shifting baselines hot days germany weather

Using broadly recognized generational labels, we can see how the average perceived number of hot days per year changes for each consecutive group. Baby boomers, born between 1946 and 1964 start with 4 days a year, and this actually stays put for the Gen X time period. Millennials, however, experience a new norm in the form of 6 a year, while Gen Z has only ever known a world in which the yearly average is 9. 

Before going any further we must warn that these results paint a stark picture, but that such a short period in time looking at a single metric could simply be an exceptional anomaly. We do not claim to be demonstrating the effect of climate change through our analysis, but rather illustrating a subset of what has been robustly demonstrated by the world’s leading researchers. 

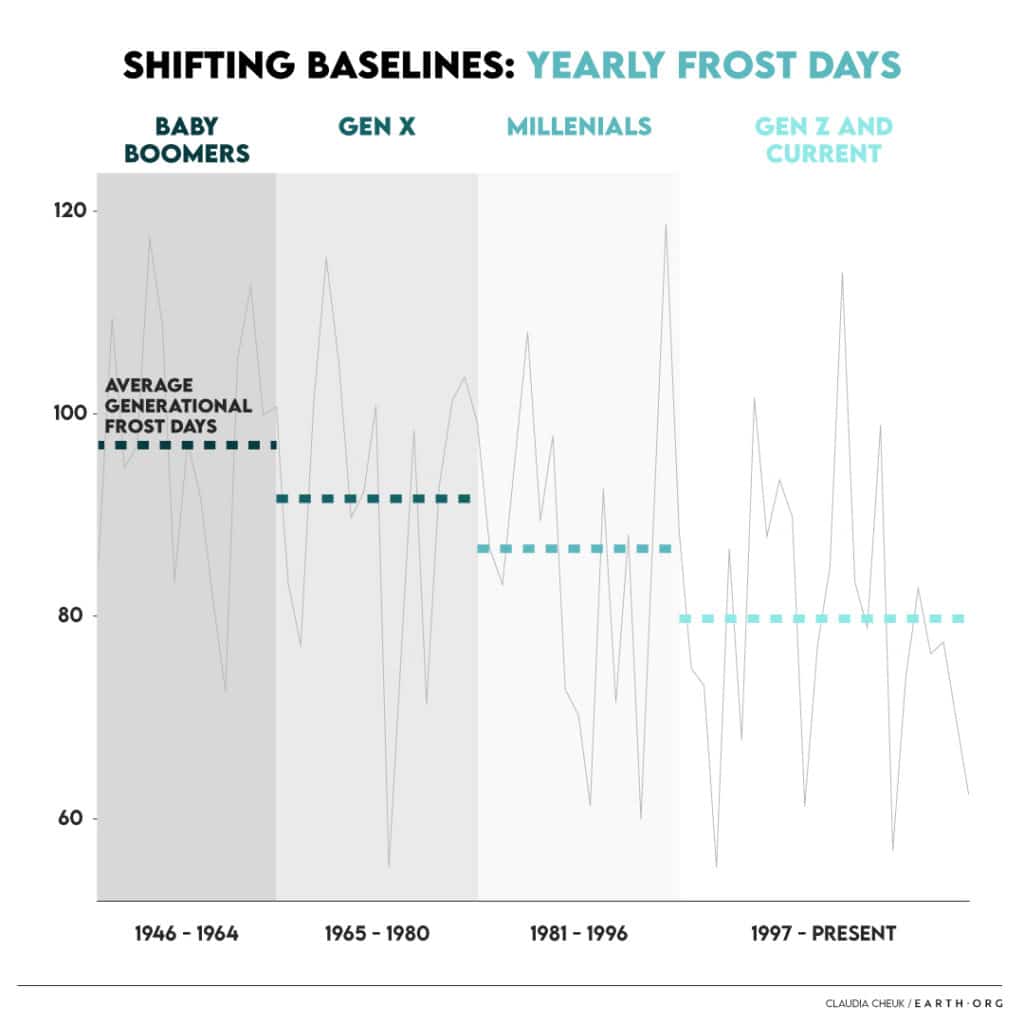
Now, let’s take a look at “frost days” in Germany over the same time period. These are defined as days (or nights) where the minimum air temperature drops below 0.0°C. 

shifting baselines frost days germany generational aerage perception change

An even sharper generational contrast appears, with a fairly regular stepwise drop of about 4 frost days between each group’s average early-life experience. Over the course of nearly 60 years, both long in human terms and incredibly short in climatological terms, a 16 day change occurred, significant from both perspectives. 

Of course, our lack of pattern-recognition is in large part due to the high year on year variability, which you can see in the graphs that underlie the averages. 

Key to the fight against climate change is the level of global awareness. Let’s assume that once awareness (and an equally assumed level of care for the issue) needs to reach a certain level before we effectively decide to solve the problem. If an individual notices a degree of change for the worse throughout their lifetime, they will become more aware, thus increasing global awareness level, both through their own opinion and that of the people they influence around them. Then comes along the next generation, which automatically assumes its birth conditions are the norm, thus erasing some of the progress made, generation on generation. 

The Gridlock is Breaking

Unfortunately for us, climate change has significantly worsened and accelerated over the past two decades. As a result, the scientific community went from quite certain to very sure that it is real, quelling most (if not all) climate denialist discourse. Authorities have since begun recognizing and planning for it, while media coverage has increased, helping sway public opinion. We are therefore breaking through the shifting baseline syndrome’s paralysis effect as a result of climate change’s growing momentum.

One could argue that the damage is already done. It is part of what got us here, along with financial incentives conflicting with the greater good and, if we go far back enough in time, a simple lack of knowledge. Now the power of the internet, data, visualization and engaged reporting helps overcome temporal and spatial barriers to knowledge. The battle remains far from won however, and if you have read this far, please do your part in spreading the knowledge to your close ones. It all adds up, even if the result unfolds beyond our range of perception.  

This article was written by Owen Mulhern. Data Analysis by Daniel Müller-Komorowska.

You might also like: Air Pollution in Paris


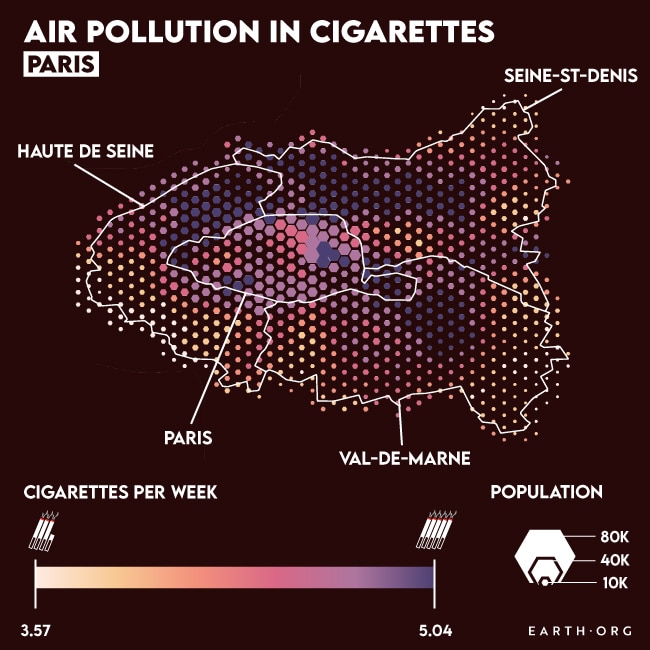
Air pollution is the third leading cause of death worldwide, and most large cities, Paris included, have fine particulate matter (PM2.5) levels above WHO health guidelines. Here, we take a look air pollution mapping in Paris and better understand the current situation, and where things may be heading. 

Lavoisier first started questioning air quality in 18th century Paris, just as the Industrial Revolution was taking place. A first study on (translated): “The question of whether industrial activity which exhales a bad smell is nefarious to health” appeared in 1804, written by two chemists. Despite the subsequent governmental classification of industrial activities into 3 categories by severity, this was based on smell only, as were most of the complaints lodged against the sector for quite some time. 

These nuisances were addressed by technical measures, such as minimal height requirements for chimneys and leak-proof walls in factories. However, air quality itself remains ignored. 

A host of literature describing the horrible conditions of blackened air and cities appears in the second half of the 19th century, as its noise and pollution became impossible to ignore. It wasn’t until 1898 that a law banning “Heavy and extended black smoke emissions” was passed. However, these issues became an administrative problem rather than a legal one, meaning that surveys were led by hand-picked “experts” and rules were easily circumvented.

Around the year 1900, Parisians knew they had a serious pollution problem. No, not smog and particulate matter, they said, but the dung from over 80,000 horses carrying people and loads around the city everyday. Officials decided to test moving horse-drawn vehicles to the verge of the Champs-Elysees causeway, while motorized vehicles would be given the center. The contrast between the manure-laden and rubber-smoothed aisles left people convinced (translated from a French article in the “Figaro”): “It is easy to see that, from a hygienic standpoint, automobiles whose exhaust is rapidly absorbed by the air, are preferable to equestrian carriages.”

Massive industrialization throughout the century led to many new forms of pollution, and despite some rudimentary measurements of CO2’s distribution through Paris, not much action was taken. 

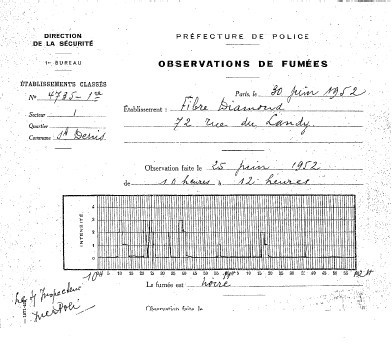
Interestingly, the tool for measuring smoke quality was a set of 5 pieces of paper, shaded gradually from white to black. Smoke color was compared to that of the papers and thus recorded. 

paris air pollution

Source: https://journals.openedition.org/vertigo/docannexe/image/12826/img-4.jpg

A deadly event in Belgium, 1930, changed the general perception of pollution. The Meuse Valley fog was described as the thickest anyone had seen – it caused many road accidents and killed 60 people by dyspnea (shortness of breath). The three day ordeal was the result of heavy industrial pollution combined with the wrong meteorological conditions.

Similar events in Pennsylvania (1948), Paris (1951) and London (1952) forced authorities to set up regulatory bodies to tackle the problem. Laws setting hard limits on car and industrial exhaust came through in the 60s, and widespread, standardized pollution monitoring appeared in the early 70s. 

A growing awareness of the detrimental effects of climate change on the international stage accelerated governmental action from the early 90s onward. Combined with more efficient transport technology, this has culminated in a broad drop in nearly all types of pollution over the city of Paris (i.e. the greenhouse gas CO2, and toxic gases like nitrogen oxides, particulate matter and sulfur dioxide). There is a caveat however: central Paris and a few other high-throughput passages are actually more polluted than they used to be. In fact, 90% of Parisians are exposed to PM2.5 above WHO guidelines (exposure of ~15 micrograms per meter cube compared to a recommended 10).

Ground-level ozone, a chemical mix of other pollutants whose formation is accelerated by sunlight is also on the rise. It irritates eyes, nose and throat, and worsens heart and respiratory conditions. There have been pollution spikes in recent years where people of all ages found themselves coughing and visibly affected by these symptoms. 

A mid to long-term plan is in place to reduce traffic and replace diesel cars with an electric fleet, but the parisian mayoral authorities have hit many roadblocks and gone far beyond their budget. Paris air pollution levels are high and unhealthy, yet there is a desire to fix it, it just isn’t that easy. 

We illustrate the situation prior to COVID-19 beneath by using an air pollution to cigarette equivalency defined by Berkeley Earth.

air pollution in cigarettes equivalent pm2.5

Air pollution mapping in Delhi. PM2.5 data from NASA-SEDAC (2016).

There has been a significant drop in pollution since, but Paris air quality is expected to come back to pre-COVID levels once restrictions are lifted. Respiratory disease has now become the third leading cause of death worldwide, behind cardiovascular diseases and cancer, and as developing countries continue to industrialize with loose regulation, the problem will only become worse. It is important to talk about these issues and promote awareness, while actively taking part in your area’s or country’s politics so our concerns can be heard.

This article was written by Owen Mulhern. 

You might also like: Bioplastic: A Wolf in Sheep’s Clothing?


The time is ripe for innovative solutions to the climate emergency, and carbon capture is a sector with high potential. Here, we present Out of the Blue‘s novel proposition for a system that could take CO2 directly from the ocean, in a more efficient way than from the air. 

Earth.Org takes a closer look.

Global efforts to decarbonize our society are intensifying, and encouraging goals have been set for mid-century. However, even the most ambitious of these is too little to prevent 2°C global warming, the consequences of which are highly undesirable. There is therefore a demand for carbon capturing technologies that would allow us to essentially create negative emissions. 

In an ideal world, we would stop emissions as soon as possible, then begin undoing the damage by removing the carbon we’ve emitted for the past 200 years or so. Unfortunately, while carbon capture is entirely feasible, it suffers from lack of scalability and affordability. It is certainly not good enough to allow it to continue as we have.

Current tech focuses on recapturing the emissions from biofuel combustion, where the carbon is caught and pumped far underground into old oil and gas reservoirs or saline aquifers. Another approach is reinforcing the natural processes that act as carbon sinks through forest restoration or rock weathering. The problem is that these require more land than we have to fix the situation, as does carbon capture from biofuel. 

There is growing investment in innovative carbon capture technologies that tackle the problem from a different angle. One such idea is that of Out of the Blue, a start-up whose mission is to remove CO2 from the ocean in a safe, cost-effective and scalable manner. It was founded by Lennart Joos, a chemical engineer who went from academia (UC Berkeley, EPFL), to industry (TOTAL, Umicore), to creating his own startup. He explains that innovation has always been one of his core drivers, and after years fighting climate change he has formulated a viable solution. 

As you may know, the world’s oceans absorb nearly a third of our carbon emissions along with much of the excess atmospheric heat these produce. CO2 dissolves into carbonic acid once in the water, driving up oceanic acidity and hampering animal shell-formation. Phytoplankton, one of the main carbon sinks in the ocean, need these shells to survive, which means that runaway acidity levels will massively lessen the ocean’s carbon capacity. It is therefore just as beneficial to extract carbon from the ocean than it is to do so from the atmosphere. 

Let’s look at the technology in more detail. 

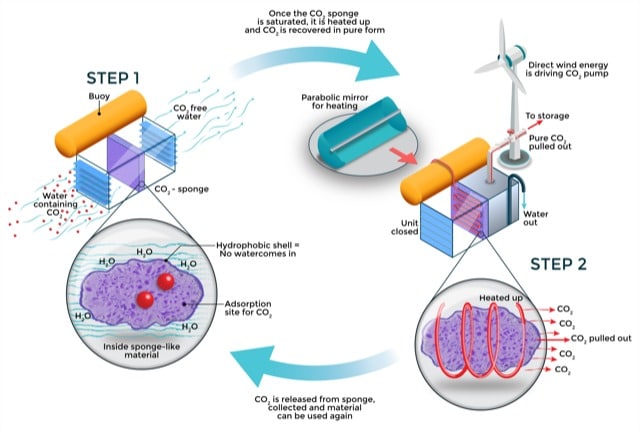
CO2 carbon capture removal innovative solution out of the blue

Source: Out of the Blue.

A carbon-binding sponge material is suspended just under the water surface in a container that allows carbon-loaded water to sift through unidirectionally. Once the sponge is saturated, the container is closed off and heated, upon which the carbon is released, leaving the sponge available for reuse (potentially several thousand times). Ideally, a renewable energy source is used, like a mirror for heating or direct wind energy for pumping the CO2 out. Once collected, the gas can be sequestered as is already done with existing carbon capture technology.

The reusable nature of the apparatus along with its low operating costs (just place it there and water movement does the rest) make it economically attractive. On top of this, other ocean-based renewables (like wave power) are gaining traction and could possibly fill Out of the Blue’s energetic needs. 

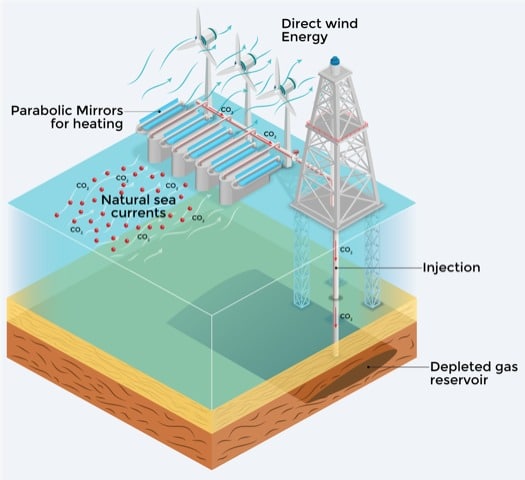
The ideal deployment for this technology is to harness it to pre-existing drilling platforms with access to depleted gas reservoirs, thus integrating the full process of capture to sequestration into a single system. 

carbon capture removal out of the blue innvoative solutions

Source: Out of the Blue.

It must be stressed that Out of the Blue is still in its infancy, but we at Earth.Org support the research and development of climate solutions, and believe our readers can benefit from hearing about these endeavors. 

If you are or know anyone who is working on innovative solutions, please get in touch via our contact email address and let us know! 

This article was written by Owen Mulhern

You might also like: Why Do Some Not Perceive Climate Change as a Crisis?


Subscribe to our newsletter

Hand-picked stories weekly or monthly. We promise, no spam!

SUBSCRIBE
Instagram @earthorg Follow Us