


Who knew chasing down the future of the Earth’s climate could be so much like Sherlock Holmes or a CSI Miami episode; hunting down perpetrators. That’s essentially what Sebastian Sippel and his colleagues have done. Using the latest modeling software to sift through the global data network and find clues and fingerprints, the have shown that we can detect climate change from nearly any single day’s data since 2000.
—
The network that brings us our weather reports and climate averages consists of over 22,500 data collection sites worldwide according to the World Meteorological Organization (WMO). These collection sites record many details of our atmosphere and surface conditions such as greenhouse gas concentrations (GHGs), precipitation, humidity, wind direction and speed, high, and low air pressure, temperature. Etc. While this information is vital to the understanding of our environment; It also creates a lot of data to sift through to find those clues. Think of it as those detectives looking for criminal’s prints in a taxicab, there are likely 100’s of people’s fingerprints in the taxi; It creates interference for those dusting for prints. This interference or white noise as it’s referred to by Sippel and colleagues is one of the major hurdles they had to overcome to solve the question; Can a single day of global weather patterns be used to detect climate change?
Climate is the average weather pattern observed in a given area for a minimum of 30 years. Weather is the atmospheric conditions we experience from day to day. For a visual, the graph below was compiled using Nasa’s collection of global surface temperature averages for the last 140 years. The black line is essentially global weather, the red line is climate.
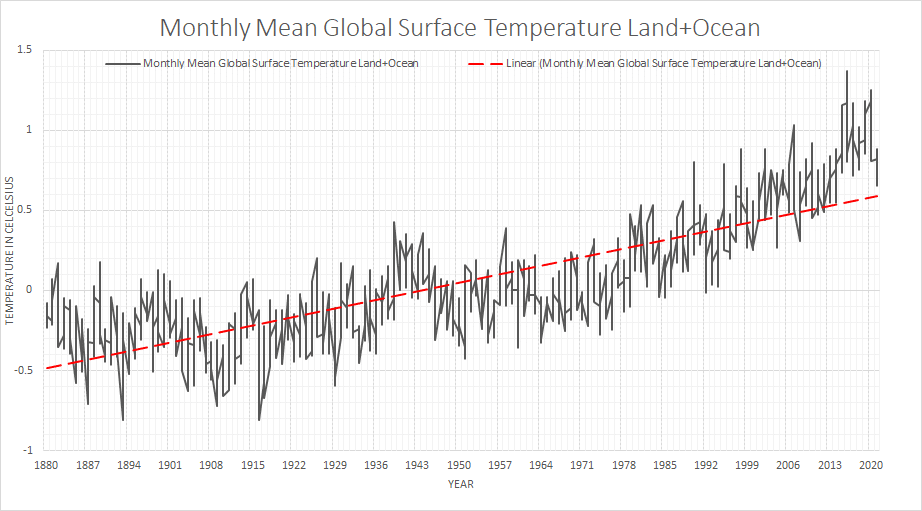
Collection of average global surface temperatures. Source: NASA.
It’s why when we see snowballs it doesn’t disprove global warming.

On Feb. 26, 2015, U.S. Sen. James Inhofe (R-OK) brought a snowball to the Senate floor.
We are like frogs in hot water; if it weren’t for the global network collecting gobs of data, then the steady increase in temperature, decrease in precipitation, and other telltale signs of a changing climate might easily be ignored by many outside the scientific community, and the marginalized groups where climate change is a fight for survival.
It begs the question; how then would it be possible to detect and extract the appropriate data or “fingerprints” in a single day when these climate projection models are based on millions of data points over a time scale of 30 years?
To answer this, we turn to the study of Detection and Attribution; basically, the individuals that try to identify factors of “external climate forcing.” External climate forcers are elements independent of climate that contribute to its change (mostly human-driven) such as fossil fuel extraction and combustion, deforestation, and reduction in the Earth’s surface reflectivity or albedo.
Sippel and his colleagues wanted to determine if these external forces could be detected on smaller time scales compared to that 30-year average. First, they had to determine the physical scale of the study: local weather patterns suffer from extreme variability depending on the region, sometimes going against the global trend (e.g. breaking cold records when the world as a whole is warming). Looking at things from a global perspective cancels out extremes into a planet-wide average, giving a more accurate picture of the situation.
Next come the monitored variables: external climate forcers are exerting pressure on many of our climate’s components (e.g. wind speed, season lengths, humidity, etc), but to simplify the search for a visibly enforced change, or a “fingerprint”, the authors of the study chose to look at daily temperature and humidity anomaly patterns.
To test whether these could be used to detect climate change, they chose to start with a larger collection of daily anomalies over two separate time scales before scaling down to a single day. The first time scale, 1951-1980 (grey bars), and the second from 2009-2018 (orange bars).

Figure 1. The distribution of local (a,c) and global (b,d) daily temperatures in two different datasets: the NCEP 1 reanalysis dataset (a,b) and in the CMIP5 multi-model archive (c,d). Source: Sippel et al. (2021)
Notice the bulk of local temperature anomalies swing between 5 and -5°C but low differentiation between time periods. Conversely, the global anomalies only range from 1 to -1°C but have a clear shift demonstrating the effect of climate change during the interval.
The question was could they detect climate change this way again, but with only a single day of data?
To do this, they ignored the averages of global weather because it masks the more extreme peaks that characterize climate change. Using multi-model platforms, they modelled the range of natural variability using past data and compared it to the range of observed variability on a single day since 2000; if the day’s extreme is greater than natural variability that proves climate change is driving the shift. The results were astonishing – a large majority of days in the past two decades showed clear fingerprints of enforced climate change, with temperatures and humidity levels going beyond their natural ranges.
While Sippel and his colleagues have completed a stunning achievement, this should also serve as a wake-up call for us. Humans are the biggest external climate force. We are on a train headed for a wall and many leading countries are choosing to lean on the accelerator rather than implement significant policy changes. One of the biggest ways this is being played out is in fossil fuel extraction and combustion. Below is a visual taken from C-ROADS; it’s an interactive website that allows you to experiment with different policy adjustments and see how regional and global shifts can change our climate future.

We see the global CO2 emissions record from 1900 to the present day (red), the global temperature correlation from 2000 projected into the future (purple), and the projected temperature increase for the end of the century.
Notice the increase in CO2 starts to ramp up around 1975, There is a delay from climate forcing factors to the impact we see and feel. According to NASA, CO2 lingers in our atmosphere from 300-1,000 years. In a sense the year 2000 was a climactic tipping point, where we put enough CO2 and other GHGs in our atmosphere to cause radical acceleration in global temperature increase, and climate change.
Climate scientists admit they are behind on their understanding of the full repercussions of climate change. Frankly, climate change is out-pacing researchers; studies take time, interest, and money. The responsibility of the scientific community is to discover and to educate. The responsibility of our governments and the rest of us is to act; if not, down the line when future generations look for the cause of the planetary detriment it will be our fingerprints they find.
This article was written by Sean Porter.
You might also like: Air Pollution in Shanghai


![The Statistics of Biodiversity Loss [2020 WWF Report]](https://earth.org/wp-content/uploads/2020/12/lprwinkyTHB-544x306.jpg)


