


Tonga is an archipelago consisting of four clusters of islands, located northeast of Australia. With sea level rise at twice the global average speed, communities have already begun forced relocation.
Earth.Org takes a closer look.
—
The Kingdom of Tonga is an archipelago, which has 169 islands and only 36 of them are continuously inhabited. The island of Tongatapu is home to Tonga’s capital, Nuku’alofa. With a population of 70,000, it is home to 80% of the country’s population. The sea level around the country has risen by about 6 millimeters per year, which is double the global average. Similar to Palau, an island nation in the Pacific, higher ground in Tonga is mountainous and unsuitable for human habitation. A lot of infrastructure at sea level must be rebuilt annually as roads and paths are washed away due to the rising sea level and higher frequency of storms.
Several communities on the smaller islands have already relocated to other islands due to rising seawater and severe coastal erosion. The Hihifo District, southeast of the capital, feels climate change’s impacts most acutely. The combination of less rainfall due to the El Nino-Southern Oscillation (ENSO) and saltwater intrusion into the groundwater aquifer has left inhabitants with very little freshwater. In Ha’apai, a group of islands south of Tongatapu, coastal erosion has carved up to 40 meters of land off the island.
In 2010, the Tongan government developed a 5 years joint national action plan, Pacific Adaptation to Climate Change (PACC), that focuses mainly on water quality and access. Most Tongans remain vulnerable to displacement as they continue to lose ground to the ocean. It may not be feasible for the government to create a long-lasting defense for its people, in which cases Tongans may soon become a nation of climate refugees, likely moving toward New Zealand and Australia.
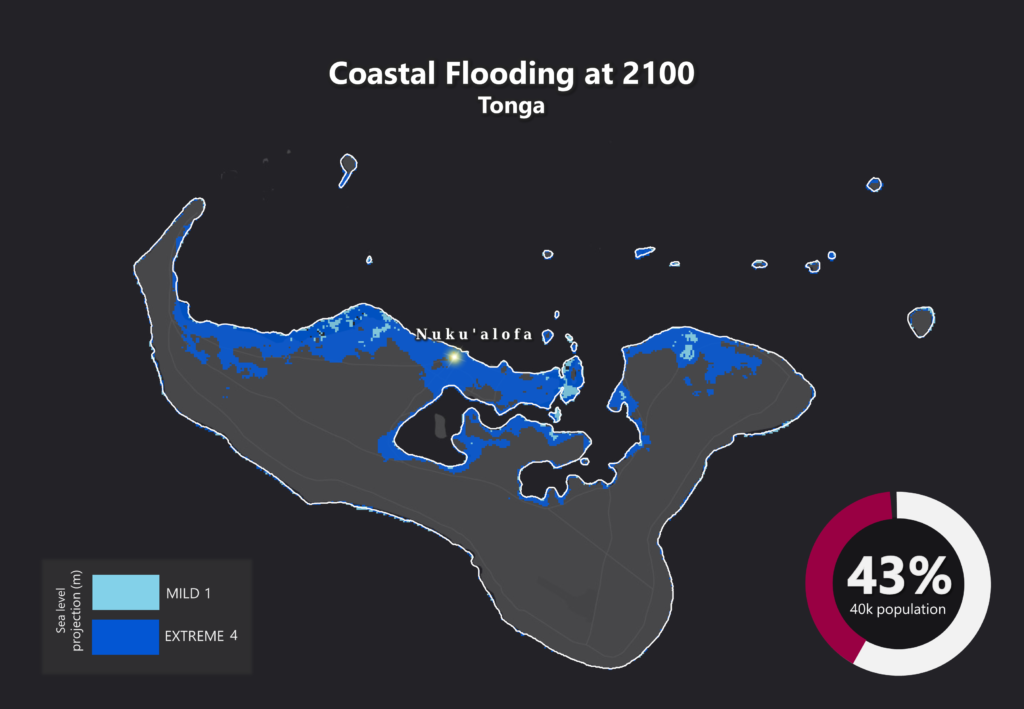
Earth.Org has modelled severe flooding in Tonga by 2100 to illustrate the urgent need for action today.

Sea level rise projections by 2100 for two scenarios with the amount of rise in meters indicated (mild = 1m; extreme = 4m). Population displacement indicated bottom right.
Methodology
Global mean sea level is projected to rise by 2m at the end of this century. However, in order to determine local sea level rise (SLR), one has to take into account local coastal flood levels which could be 2.8m above Mean Higher-High Water (MHHW) at extreme forecasts. These local levels bring variability to the projected SLR from 1m to 6.5m (eg. Rio vs Kolkata).
The SLR scenarios used in this study are based on the forecasts from Climate Central – Coastal Risk Screening Tool with the following parameters:
- Sea level Projection Source
- Coastal Flood Level
- Pollution Scenario
- Luck
Sea level Projection Source
From two highly cited journals by Kopp et al., estimating SLR mainly due to ocean thermal expansion and ice melt. The mid-range scenario projected 0.5-1.2m of SLR based on different representative concentration pathways (RCP) defined by the IPCC. While the pessimistic scenario added more mechanisms of ice-sheet melting, estimating SLR at 1m-2.5m in 2100, with a projection of 10m SLR at 2300.
Coastal Flooding
More frequent coastal flooding is a direct impact of sea-level rise. Based on the Global tides and surge reanalysis by Muis et al., (2016), it is estimated that the extreme coastal water level could be from 0.2 – 2.8m over the mean level. While in extreme cases like China and the Netherlands it could experience 5-10m of extreme sea levels. Here, the coastal local flood level is added on top of the projected SLR.
Pollution Scenario
Allows choosing the RCP, the greenhouse gas concentration trajectory defined by the IPCC. The mild level is based on RCP4.5, of 2°C temperature rise; while the Extreme level is based on RCP 8.5, of 4°C temperature rise.
Luck
Applies to the baseline SLR, defined in the “Sea level projection” section, upon which we add flooding. “Mild” refers to the mid-range scenario of 0.5-1.2m, and “extreme” to the pessimistic scenario of 1-2.5m. We used the high-end value of each scenario (mild = 1m; extreme = 2.5m).
Mapping and methodology by Braundt Lau. Article written by Wing Ki Leung and Owen Mulhern.
You might also like: Sea Level Rise by 2100 – Miami
References:
-
Kulp, Scott A., and Benjamin H. Strauss. “New elevation data triple estimates of global vulnerability to sea-level rise and coastal flooding.” Nature communications 10.1 (2019): 1-12.
-
Florczyk, A. J., Corbane, C., Ehrlich, D., Freire, S., Kemper, T., Maffenini, L., Melchiorri, M., Politis, P., Schiavina, M., Sabo, F. & Zanchetta, L. (2019). GHSL Data Package 2019 Public Release.
-
Kopp, R. E., DeConto, R. M., Bader, D. A., Hay, C. C., Horton, R. M., Kulp, S., Oppenheimer, M., Pollard, D. & Strauss, B. H. (2017). Evolving Understanding of Antarctic Ice-Sheet Physics and Ambiguity in Probabilistic Sea-Level Projections. Earth’s Future, 5(12), 1217–1233.
-
Kopp, R. E., Horton, R. M., Little, C. M., Mitrovica, J. X., Oppenheimer, M., Rasmussen, D. J., Strauss, B. H. & Tebaldi, C. (2014). Probabilistic 21st and 22nd Century Sea-Level Projections at a Global Network of Tide-Gauge Sites. Earth’s Future, 2(8), 383–406.
-
Kulp, S. A. & Strauss, B. H. (2019). New Elevation Data Triple Estimates of Global Vulnerability to Sea-Level Rise and Coastal Flooding. Nature Communications, 10(1), 4844. Retrieved June 21, 2020, from http://www.nature.com/articles/s41467-019-12808-z
-
Muis, S., Verlaan, M., Winsemius, H. C., Aerts, J. C. J. H. & Ward, P. J. (2016). A Global Reanalysis of Storm Surges and Extreme Sea Levels. Nature Communications, 7.


![The Statistics of Biodiversity Loss [2020 WWF Report]](https://earth.org/wp-content/uploads/2020/12/lprwinkyTHB-544x306.jpg)


