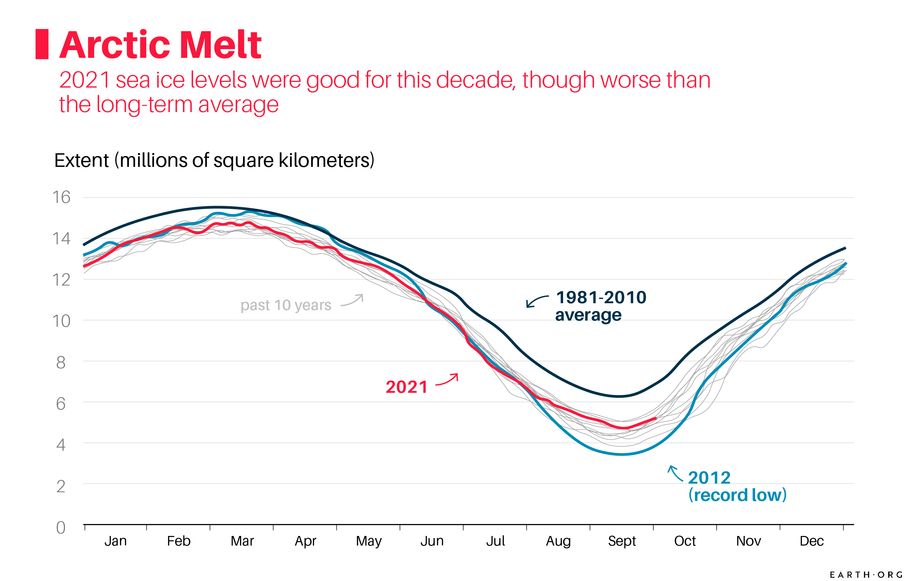
The arctic has warmed well over twice the average global pace, resulting in more sea ice melt than expected. There are a few ways to measure this, but the main method is by monitoring sea ice extent, or the oceanic area with at least 15% ice cover. Sea Ice extent hit record lows in summer 2012, summer 2019 being the runner-up. The 13 worst years for Arctic sea ice came in the last 13 years, and in 2021, its summer extent was 7.4% lower than the historical average.
Exploring the Stat
Losing ice has multiple side-effects. The first and most obvious is sea level rise, which has been accelerating and could reach 1 to 2 meters by the end of the century. Second, white surfaces help reflect sunlight into space and keep the planet cool. Its disappearance helps accelerate warming, which melts it faster, creating a feedback loop. Darker waters in the Arctic also absorb more heat. Scientists expect ice free summers could arise as early as 2035 as the system tips toward runaway melt.
The effects on wildlife are already being observed. Sea ice is extra real estate for polar bears and walruses to find food, and hunger-driven bears have drowned during ambitious, but desperate swims.
Future Outlook
As sea ice disappears, nations prepare to capitalize on new shipping routes, fishing zones, fossil fuel exploration and military activity in northern waters. However, as this develops, walruses and polar bears will lose their habitats, and the warm-weather jetstream will weaken, potentially altering European weather for centuries to come.
This article was written byu Owen Mulhern.
Check out our other indices here.
Why this Metric
Humans have taken over the world, and some say we’ve entered the Anthropocene or the era of man. Half the world’s habitable land is now used for agriculture, doing away with the forests, grasslands, shrubbery and other natural habitats that used to be.
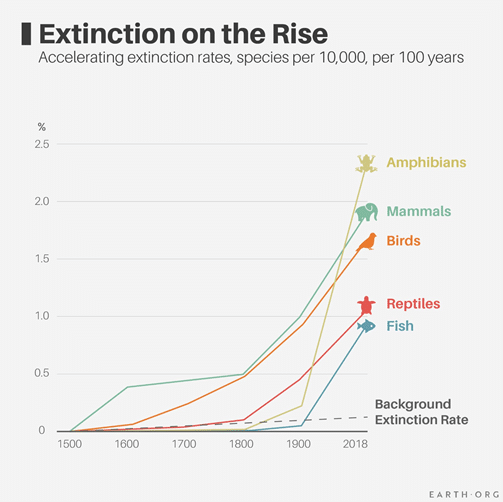
The IUCN Red List keeps track of known species populations and has estimated the number of extinctions since 1500. They estimate that about 900 species have disappeared for good and that 35,765 species are threatened with extinction today. Another study led by Gerardo Ceballos claims that extinction rates are 100 to 1000 times higher today than the baseline extinction rate (around 1 species per million per year).
Exploring the Metric
To understand the importance of this topic, we need to understand what would happen if biodiversity truly collapsed. Rich ecosystems depend on their biodiversity, and we depend on the ecosystems. The services they provide are priceless, though if we were to put a price on them, it would be US$16-54 trillion according to Robert Costanza.
As for the extinction rate itself, there are a few caveats. Our knowledge of the natural world is far more limited than one might think: we’ve identified an estimated 80% of animals such as birds, mammals and amphibians, but only 1% of insects, and less than 1% of the world’s fungi. Further, the IUCN Red List has assessed only 6% of described species. These two facts together mean that the number of identified threatened species is likely far lower than the actual number.
Conversely, Ceballos’ findings compare the base extinction rate (2 species per 10,000 per 100 years (E/MSY)) to the amount of recorded extinctions since 1500. He found that these were 100 times higher than the baseline rate. Considering there were probably far more extinctions than those recorded, the estimate is very conservative.
Future Outlook
Many have claimed that we are at the dawn of the 6th mass extinction. First, let us remind you that mass extinctions in the past wiped out 75% to 95% of all species, usually over the course of thousands of years.
This makes it perfectly plausible that we are witnessing the start of a new, human-induced extinction episode. Whether or not this is the case, time will tell, but one thing is clear. Were ecosystems to collapse, no amount of bailouts would make up for the lost services they’d have provided. This problem enters the realm of serious existential crises that humanity will face a number of over the next few centuries.
Editor’s note: We left out the “Where the numbers come from” section you’re used to because methods are a core part of the discussion. If you wish to do some further reading, the IUCN’s methods are available here.
As the second most abundant greenhouse gas in our atmosphere (after water vapor), carbon dioxide (CO2) has become a direct proxy for measuring climate change. Its levels have varied widely over the course of the Earth’s 4.54 billion year history, partly driving swings in our planet’s average temperature.
—
The History of CO2
Scientific consensus today describes our atmosphere’s evolution in three stages. Around the time of Earth’s formation, our solar system was dense with helium and hydrogen which bounced around the Earth’s surface at extremely high temperatures. These molecules eventually escaped into space and were replaced by our second atmosphere: volcanic emissions. Eruptions dispersed water steam, CO2, and ammonia (one nitrogen and three hydrogens), forming a gassy blanket above and water bodies below. CO2 slowly dissolved into the shallow ocean and allowed cyanobacteria to perform oxygen-emitting photosynthesis.
This oxygen eventually accumulated until the atmospheric composition changed enough to kill off most micro-organisms present at the time, about 2.4 billion years ago.
CO2 and Past Climates
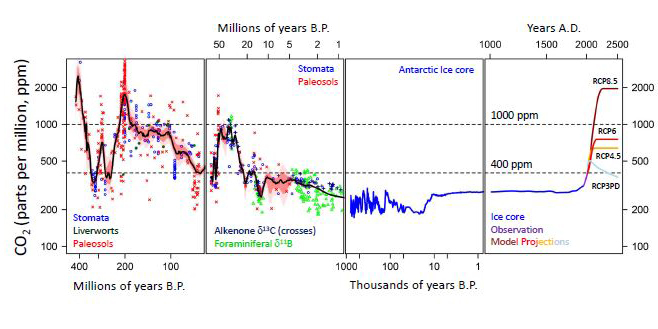
As a point of reference, pre-industrial CO2 levels were around 280 parts per million (ppm) and today, we stand near 420 ppm.
The most distant period in time for which we have estimated CO2 levels is around the Ordovician period, 500 million years ago. At the time, atmospheric CO2 concentration was at a whopping 3000 to 9000 ppm! The average temperature wasn’t much more than 10 degrees C above today’s, and those of you who have heard of the runaway hothouse Earth scenario may wonder why it didn’t happen then. Major factors were that the Sun was cooler, and the planet’s orbital cycles were different.
CO2 levels over the past 500 million years. Foster et al – Descent into the icehouse.
CO2 levels are determined by the imbalance between carbon sequestration (burial in sediments, capture by plants), and carbon emissions (decomposition and volcanic activity). Imbalances in this system created a downward trend in CO2 levels, leading to a glaciation period around 300 million years ago. This was followed by a period of intense volcanic activity, doubling CO2 concentration to about 1000 ppm. Levels then dropped until they reached today’s concentrations during the Oligocene era, 33 to 23 million years ago, when temperatures were still 4 to 6 degrees C higher than today. It can be said that history was shaped by CO2 levels, and the types of climates they would allow.
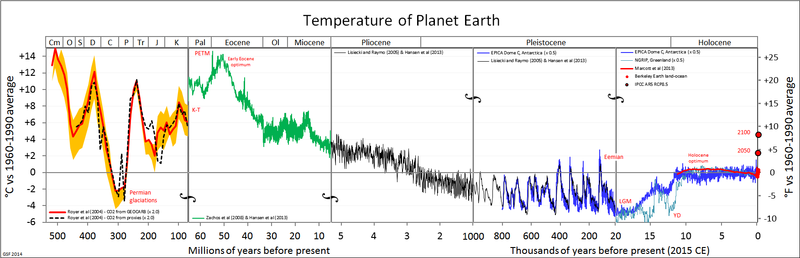
Temperature estimates over the past 500 million years. By Glen Fergus.
This is quite a worrying fact as the amounts of greenhouse gases we’ve emitted could already potentially take us back to similar conditions.
CO2 Data from Ice Cores
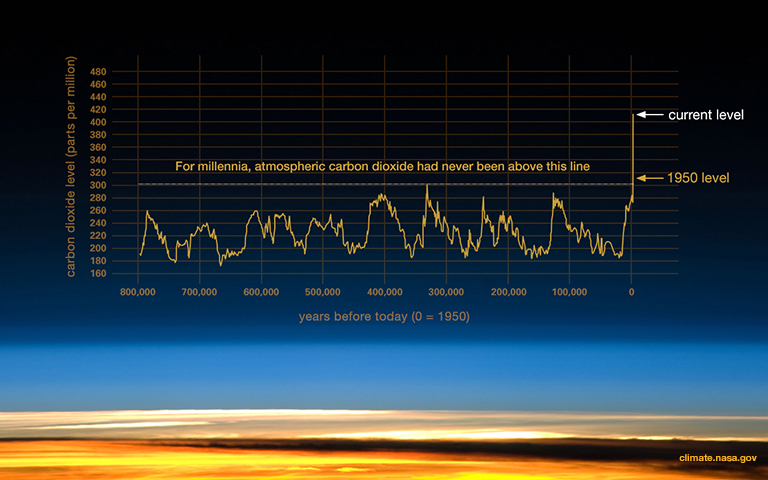
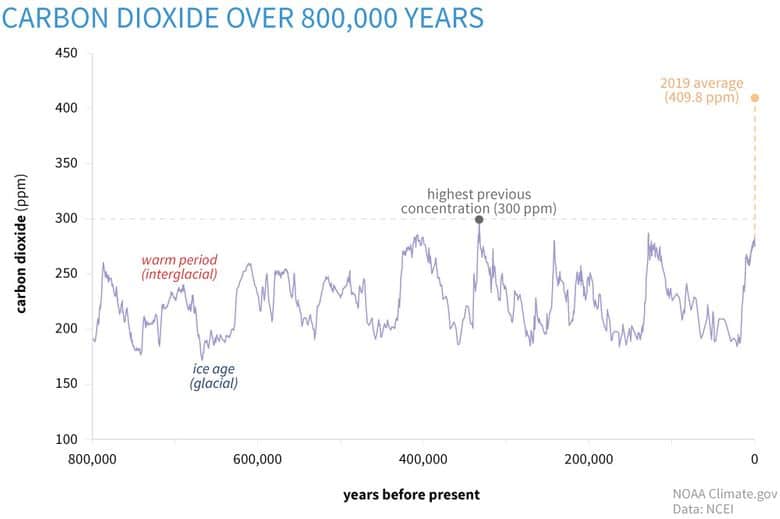
It is undeniable that the climate is an extremely complicated system with many factors that we still do not quite understand, so such statements need to be taken with a grain of salt. Moreover, the further we look back, the more uncertainty there is around the data. Robust evidence “only” spans back 800,000 years thanks to ice cores providing high-resolution records in the form of air bubbles trapped under the freezing snow.
Robust CO2 data from ice cores covering the last 800,000 years. From climate.nasa.gov
The Highest Levels of Co2 in Recent History
We use this record as a baseline to compare current events to, and the post-industrial upward trend in CO2 concentrations is evident. Unfortunately, the trend is recent enough that the results have yet to fully kick in. The time lag between CO2 emission and their pollution and warming effect is around 50 years, and whatever changes we observe now are only the tip of the iceberg.
Looking back at the 2 extra degrees of warmth last time CO2 levels were this high (Pliocene era, 3 million years ago), should be enough of a call to action considering the damage two more degrees would cause today.
Inglis, Gordon N., et al. “Descent toward the Icehouse: Eocene sea surface cooling inferred from GDGT distributions.” Paleoceanography 30.7 (2015): 1000-1020.
By Glen Fergus – Own work; data sources are cited below, CC BY-SA 3.0, https://commons.wikimedia.org/w/index.php?curid=1240577
The climate crisis is accelerating at an unprecedented rate, and we are not ready for it. While the crisis has many factors that play a role in its exacerbation, there are some that warrant more attention than others. Here are some of the biggest environmental problems of our lifetime.
—
Earth.Org’s data visualization team has decided to wrap up 2021 with some of its most popular articles. We hope you enjoy, and wish you a happy new year!
1. Poor Governance
In a world governed by economics, our society has failed to factor in the value of Nature. It provides us with indispensable resources, yet is inexplicably free to overdraw from. Its services range from air, water, food, and medicine to other less obvious things like climate regulation and natural flood defences provided by forests.
In many cases, damaging or changing the environment is considered no more than a side-effect of business activities. In economics, this is known as an externality, i.e. a cost (or benefit) incurred by the producer, that is paid (or received) by a third party who did not agree to it.
Right now, our externalities are resulting in very real financial costs for those going through amplified natural disasters (droughts, floods, hurricanes), suffering from poor health due to air pollution, being displaced by sea level rise, and many other things.
Today, the prices we pay don’t capture all the costs, and this in and of itself is one of our biggest environmental problems. We ignore this fact because the unseen costs have only begun to appear and often in places of high vulnerability.
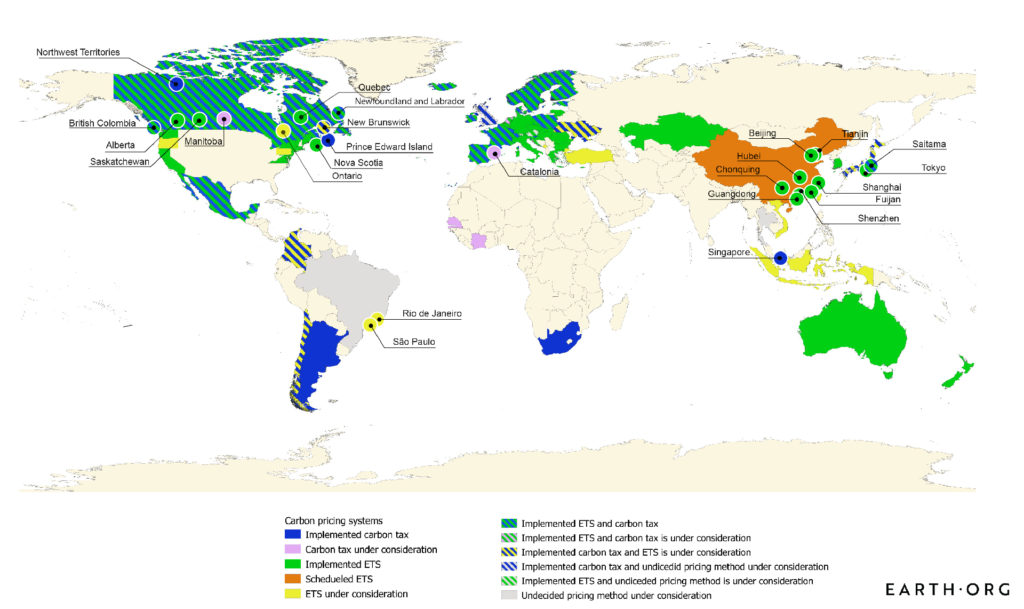
Current attempts at pricing externalities have come in the form of carbon taxes or emission trading schemes (ETS). As you can see from the map below, the vast majority of countries have opted for the latter, but ETS have had many shortcomings so far (for more, see our article here).
By Simon Papai.
Actual carbon taxes have only been implemented in Argentina, South Africa and Singapore, at values of (US) $10, $8 and $5 per ton of CO2-equivalent (CO2eq) emissions. Is that enough?
Accurately pricing carbon based on its detrimental effect on the environment is extremely difficult to do, because our best climate predictions have quite a bit of uncertainty. Therefore estimating the extent of a ton of CO2eq’s damage on the environment is impossible to confine to a single number, and the range is very wide (US $30 to over US $100).
While uncertainty and market properties make it difficult for the world to adopt a set carbon tax, it is still safe to say that US $10 a ton and under is not enough.
What you can do: be aware of when your next local or national elections are, and vote for candidates who are engaged on climate issues.
2. Food Waste
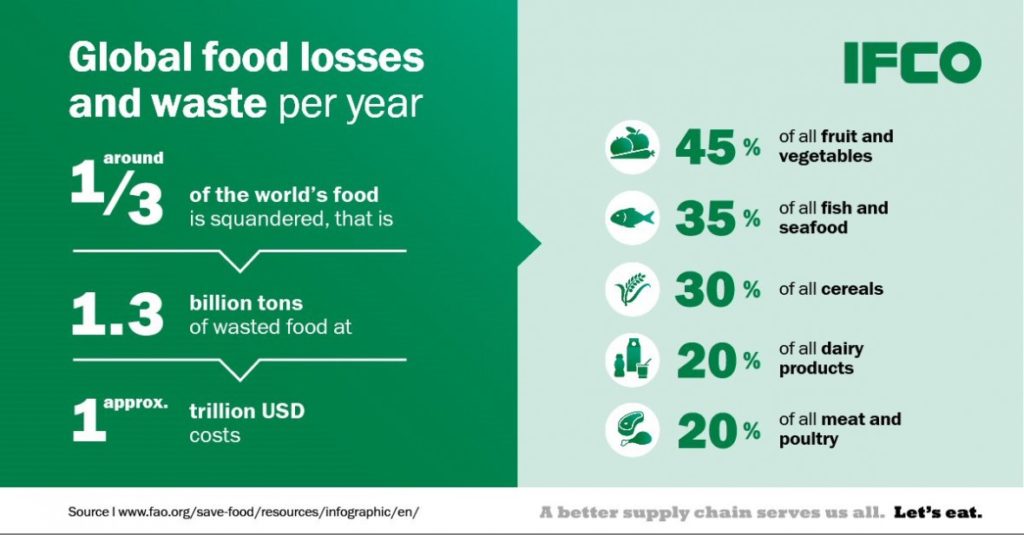
In 2013, the US Food and Agriculture Organisation estimated that around ⅓ of the world’s food was wasted every year. Since then, it has become a major issue which many entities around the world are attempting to solve.
The amount of food lost is equivalent to roughly 1.3 billion tons, which is enough to feed 3 billion people. Considering there are 690 million people suffering from malnutrition, it is clear we have more than enough for everyone to eat their fill. Beyond the human tragedy, the damage from producing this food is one of the biggest environmental problems on our planet, which we will expand on in the agriculture section furhter down.
Regarding food waste, the situation varies from country to country, but some is lost at every point along the food chain: on farms and fishing boats, in processing and distribution, in retail, in restaurants and at home. Developing countries see most of the loss occur in pre retail stages while developed countries waste more at the retail and consumer levels. In the US for instance, households waste around 43% of all food. For more, check out our article: 20 Facts About Food Waste.
Source: IFCO.
What you can do: to reduce food waste, we can shop more efficiently as consumers and avoid letting things sit past their expiration date. Governments are also addressing the problem; in 2015 the Obama administration pledged to cut food waste by half by 2030. The movement has also entered the entrepreneurial world, led by Too Good To Go, a company that connects you with retailers to help you pick up food that would otherwise go to waste.
3. Biodiversity Loss
Ever since the first Homo sapiens, biodiversity has suffered wherever we went. Today, it has developed into one of our biggeest environmental problems, with animal populations in critical state.
The 2020 Living Planet Report (LPR), published by the World Wildlife Foundation (WWF), gathered data on the declining population levels of biodiversity around the world. Globally, all monitored populations have declined by an average 68% since 1975, but some regions are in a far more critical state. Latin America & the Caribbean sustained a 94% loss over the same period.
Source: WWF Living Planet Report 2020.
The main cause of decline worldwide is land-use change, i.e. when we convert habitats like forests, mangroves or grasslands into agricultural systems. In fact, some scientists say that we are undergoing the 6th mass extinction.
What you can do: there are big initiatives to help save our biodiversity, like 30 by 30, by which world leaders have pledged to protect 30% of land and ocean by 2030. You can support these by electing representatives who support the movement.
4. Plastic Pollution
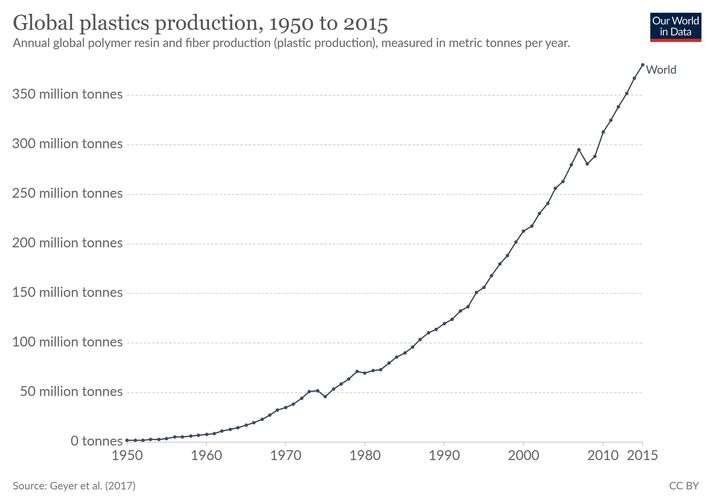
After World War I, improvements in chemistry allowed for the mass production of plastics to begin. By the 1950s, around 2 million tons of plastic was produced every year, and the wonder material’s popularity has increased ever since.
Unfortunately, market incentives for post-use processing haven’t kept up with production, resulting in one of the biggest environmental problems of our time: plastic pollution.
Of the 270 million tons of plastic produced each year, a small portion (that is, 8 million tons) ends up in the ocean. It then either sinks to the bottom, or decomposes into progressively smaller pieces called microplastics at the surface. Microplastics act like toxin sponges, binding many of the chemicals we carelessly let leak into our oceans, before being ingested by marine life. These can work their way up the food chain back to us.
But it’s more than just our oceans. Plastics have been found near the peak of Mount Everest, and car tyre rubber can go airborne and get carried hundreds of miles away. You’ll find pieces in your tap water, your beer and your tea bags.
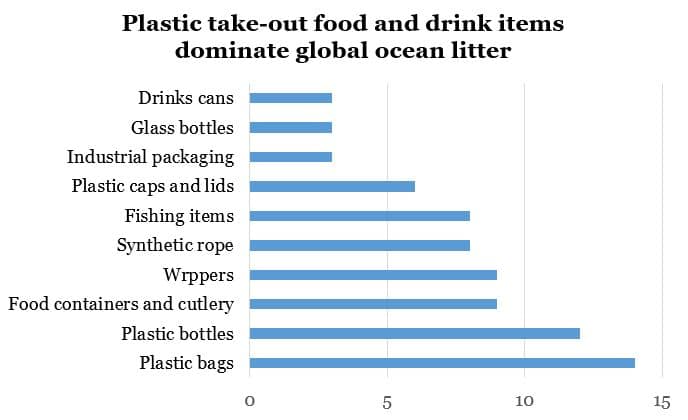
What you can do:a recent study found that the vast majority of plastic found in the environment actually comes from takeout.
Source: Caselles et al, Nature Sustainability, 2021
We have more power than we know as consumers. Every small effort can turn into a habit, and every bit makes a difference.
5. Deforestation
10,000 years ago, around the start of agriculture, forests used to cover 57% of all habitable land. Since then, we’ve lost a third, much of it replaced by crops or grazing land.
According to The World Counts, we are losing 20 football pitches worth of forest every minute, though much of it regrows. Far more critical is the rate of loss of primary forests that have remained untouched for millenia. 75% of these are found in just seven countries, and they are home to some of the most ecologically rich and diverse ecosystems in the world. New forests are not able to build up such biodiversity without centuries to do so, nor are they able to capture and store carbon so densely.
According to the WRI, we lost a football pitch of primary rainforest every 6 seconds last year, equivalent to 3.8 million hectares or an area roughly the size of Switzerland.
Not only does this lead to one of the other biggest environmental problems in biodiversity loss, but old, large forests like the Amazon provide water, materials, medicine and livelihoods for an entire continent (and beyond). Scientists say we are nearing a tipping point, past which enough deforestation will mean its slow, but inevitable disappearance.
What you can do: solutions here are more difficult for the average individual to apply, but since cattle are a large driver of deforestation, eating less meat can help. Many other products we use every day come from rainforests, such as cashews, vanilla, avocado, coffee, tea and cocoa. Make sure the ones you consume are sourced responsibly.
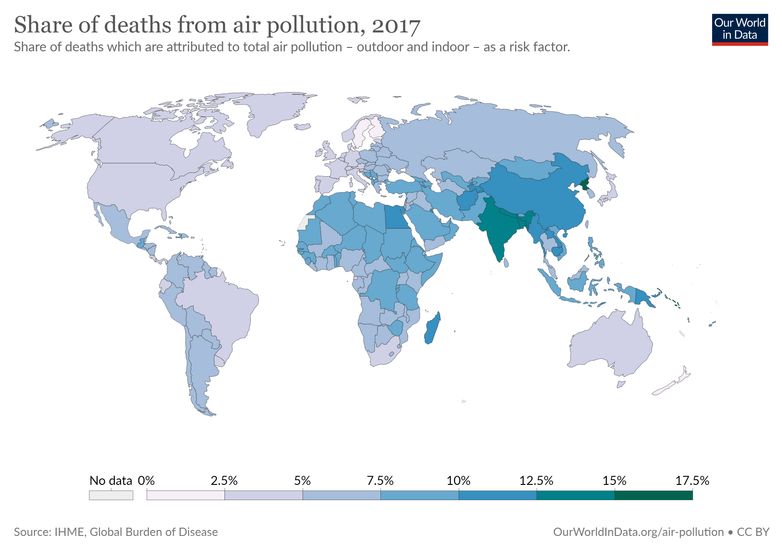
6. Air Pollution
Air pollution is one of the world’s worst killers, attributed ~10 million deaths each year making it one of our biggest environmental problems. This is far more than was previously thought, and as the world continues to industrialize, it is not expected to subside soon.
When countries develop, this comes hand in hand with air pollution – mostly from industrial and vehicular sources, but also from indoor fuel combustion. Pollution builds up in the early stages, then legislation catches up and it begins reducing. Countries in Africa are a good example, with 258,000 people having died as a result of outdoor air pollution in 2017.
In the past four decades, China went through a very polluted stretch due to its rapid development, but it has made huge progress in the last decade. Most of its major cities now are just above the WHO’s guideline levels for fine particulate matter (PM2.5).
India remains in a critical state, with routine smogs in its densely populated agglomerations, affecting millions of people everyday.
What you can do: walk, cycle or use public transport rather than your car where possible. You can also use air quality index apps on your phone to track pollution in real time and choose healthier routes for yourself and others.
7. Agriculture
Agriculture appeared around 10,000 years ago, and has since become the principal type of land usage on Earth: nearly 50% of all habitable land hass become either crop or pasture.
The bulk of its growth came after the Industrial Revolution around 1780, and expansion only recently slowed. The amount of environmental destruction necessary for such land change could be one of our biggest environmental problems on its own, but there’s more. It also emits about a third of all human-caused greenhouse gas emissions.
Sustainable food production is one of the biggest challenges ahead, because climate change threatens food production while our current farming methods degrade our soils. Traditional farming techniques have given way to chemical fertilizer-heavy monocultures where soils are left bare after harvest. Wind and water erode it and fertilizers make their way to the oceans where they can cause oxygen-depleting algae blooms, also known as dead zones.
The current philosophy is to always maximize yields, when it is actually unnecessary. We produce more than we need, and farmers have reported low cereal prices due to overproduction.
In order for this to stop, everyone needs to be on the same page, because the lone farmer who reduces fertilizer use will find himself at a disadvantage. It will likely require authorities to step in and regulate the system rather than let the market do so, but this issue is very low on their priority list if at all, bringing us back to the first biggest environmental problem on the list – bad governance.
What you can do: inform and educate those around you. Vote for the right people.
8. Global Warming From Fossil Fuels
At time of publication, CO2 parts per million (ppm) is at 417.55 and the global average temperature has risen by 1 degree celsius. This phenomenon is central to climate change, with a myriad knock-on effects, and making it one of the biggest environmental problems of our time.
The Earth has a number of carbon emitting and capturing mechanisms that interact to create patterns over long periods of time. Despite large fluctuations in the past, the past 12,000 years have been uncharacteristically stable and temperate, allowing humans to flourish.
But since the Industrial Revolution, we have been drawing on long-stored carbon reserves, emitting it into the atmosphere far faster and longer than any natural process would.
As a result, we are experiencing rapid warming, launching a cascade of effects. Rain patterns change, ice caps melt, sea levels rise, weather extremes become more intense, ecosystems falter and we struggle to adapt.
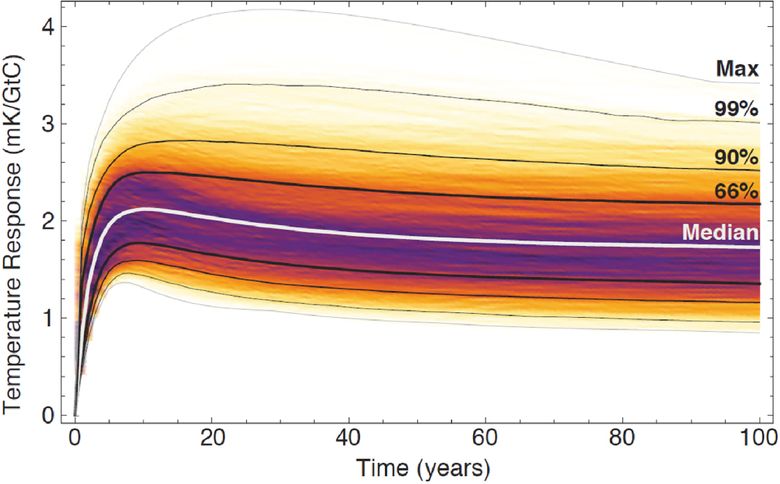
You may have heard that stopping emissions today would only mean an end to global warming around 2033. This is because, once emitted, CO2 takes some time to reach its full warming potential. Thankfully, the bulk of it happens quite fast as demonstrated by the graph below.
Temperature response to a pulse of GHG over time. Source: Ricke and Caldeira (2014)
What you can do: be aware of your carbon footprint. There are many ways to calculate and monitor it – for more see this carbon footprint calculator.
9. Melting Ice Caps
Most of the world’s freshwater is trapped in ice-form at the north and south poles, and in glaciers around the world. If all of it were to melt, sea level would rise by about 70 meters. Of course, that isn’t happening anytime soon, but the world as we know it could change quite a bit with just 1 to 2 meters sea level rise, which is expected to occur by the end of the century.
While the world has warmed by an average of 1°C, the north pole is now 2.8°C hotter than it was 100 years ago. Mountain glaciers and the Antarctic are also warming faster than the average, and as a result, ice melt has been accelerating globally. This visualization by Iman Ghosh illustrates the situation admirably.
Ice bodies are self-sustaining systems, and once enough is lost, they can enter the long, irreversible process of fully disappearing. The question of when exactly that threshold is crossed is incredibly hard to determine, so it would be wise to play this extra safe.
Mountain glacier melt is of particular concern, because they melt quicker and earlier each year, leading to potentially dangerous water overflow, followed by water shortage. The Hindu Kush, also known as the Third Pole, provides water to 2 billion people, and it is melting rapidly. The Andean glaciers in South America shrank nearly a third between 2000 and 2016.
All the above leads to sea level rise, the next biggest environmental problem on the list.
What you can do: once again, this comes down to carbon emissions. You can make smart decisions in your everyday life, but you must also make sure you elect the right representatives to push for green reform in your country.
10. Sea Level Rise
A recent paper published in Nature tripled the previous estimates of global vulnerability to sea-level rise and coastal flooding. Most sea level rise projections prior to this one fell below 1 to 1.5 meters, but it seems now that 2 meters is possible. Were that to happen, the authors of the study estimate that 680 million people would find themselves displaced, ushering in a gradual yet inexorable rearrangement of the coastal world.
Up to 3 billion people depend on the ocean and its ecosystems, and as a result, a massive amount of infrastructure and operations have been set up on low lying coastal land. Little attention has been given to rising sea levels, meaning adaptation will be arduous and costly.
Rising sea levels also make storm surges more potent, thus increasing flood potential in storm susceptible places like Bangladesh, the US and many others. In fact, over 70% of all natural disasters since 2000 were water-related, so their itensification spells trouble for people all over the world (Germany was hit with an unexpectedly powerful flood just a few days prior to publishing).
FOr a more visual example, let’s look at Shanghai’s megalopolis, built around the low-lying Yangtze river delta.
Data from CoastalDEM, Kulp & Strauss (2020).
As the 4th most populous city in the world, it could find itself so vulnerable to flooding that the whole area would have to be evacuated, or massively engineered to resist, by the end of the century. Sea level rise, while slow, is undeniably one of the biggest environmental problem on our hands and we need to prepare.
What you can do: if you are deciding where to live, be aware that a low coastal area may not be viable within the next few decades. If you do live in one, get in touch with your local representatives to find out what they are doing to prepare.
11. Food and Water Insecurity
The final of the biggest environmental problems on our list is food and water insecurity. Conflict and climate have long left people bereft of food and water. Now, climate change and population growth are set to worsen access to these fundamental resources.
While the number of undernourished people has been decreasing, there remain over 650 million worldwide. As explained above, we have a food surplus that is going to waste, and we need to do a better job of directing it toward places in need.
Undernourished numbers have stalled since the early 2000s, and there is no real reason to think they will drop again soon. In fact, they are more likely to begin rising again due to climate change.
A warmer atmosphere changes rain patterns, making droughts more frequent and intense, and rains more torrential and destructive. Countries with food insecurity usually have difficult climates to start with and as things get worse, other problems arise. Hunger drives conflict, which combined with a lack of finances makes it incredibly difficult to adapt.
Nations in the Sahel, the Horn of Africa and many others will need external help, as they will bear the early brunt of the climate crisis; how the global community handles these crises could be a defining moment of solidarity for humankind.
As for water issues, they will affect rich and poor countries alike, though the latter will once again have more to deal with.
Water issues are tightly linked to natural disasters, 73.6% of which were water-related between 2001 and 2018. According to UNICEF, 450 million children live with high water vulnerability, meaning they do not have enough to meet their everyday needs. When a disaster strikes, their water sources can be contaminated with diseases like cholera or typhoid disease, or simply destroyed.
High-income countries have their share of problems too – rising temperatures can make freshwater more suitable to microbes like Vibrio vulnificus, otherwise known as flesh-eating bacteria, cases of which have been occurring in the US. It’s western portions are also dealing with one of the worst droughts in recent history, and water reservoirs are at all-time lows. Since 70% of freshwater goes toward agriculture, this will eventually come back to affect food supply.
To cap it off, sea level rise is making coastal freshwater salty, and sometimes even causes ocean water to seep into underground aquifers, our last resort water stores.
The UN has warned that one in four children, nearly 600 million, will be living with extreme water scarcity by 2040.
What you can do: these issues are tied to the development of poorer countries, and how we handle climate change as a global community. The more we do now, the easier it will be for high-income countries to lend aid to those in need. It must not be underestimated how crucial it is for world leaders to set the right example for the rest to follow.
Stay informed, educate those around you and vote; the little things add up.
This article was written by Owen Mulhern. Cover photo by Matt Palmer on Unsplash.
This complex system forms one of the biggest environmental problems in the world, but will mainly affect people in crises areas. , biggest environmental problems, biggest environmental problems, biggest environmental problems
Why this Metric?
Excess greenhouse gases are trapping heat in our atmosphere, but close to 90% of that heat has been absorbed by the ocean. Its predominantly dark colors attract heat, and water can store more energy per unit volume than air, making it an excellent heat sink.
The first measurement of oceanic heat content, performed in 2000 by Sydney Levitus of the U.S. National Oceanic and Atmospheric Administration (NOAA), identified a 40-year warming trend that has accelerated since. A more recent study found that the past five years are the top five warmest years since modern measurements began. To give a sense of scale, the ocean is absorbing the equivalent of 8 to 12 Hiroshima atom bombs of heat per second.
Exploring the Metric
Because the ocean can absorb so much heat while keeping its temperature stable, many oceanic species are adapted to a tight temperature niche. Coral reefs are an example of how slight changes in temperature, if sustained, can kill off entire ecosystems.
Ocean warming is also not uniform, and there is such a thing as an oceanic heatwave. These arise from a variety of factors, and have caused ecological disasters like mass starfish and kelp forest die-offs, and deadly algae blooms.
The data was patched together from a variety of point measurement sources including moorings, gliders, and robotic instruments under the Argo program, which monitor the upper 2km depth of ocean around the world.
The data was compiled by the Institute of Atmospheric Physics (IAP) and gap-filling between points done by computer models.
Future Outlook
Oceanic ecosystems can and will adapt to warmer waters in time, though too violent an onset can cause mass dying to occur before the empty niches are filled. We are navigating uncharted waters here and it is difficult to tell how things will develop.
What is certain is that coral reef bleaching and kelp forest loss are just two examples of rich underwater habitats disappearing. It is likely that the ocean will continue to depopulate itself of fish in the coming decades, threatening livelihoods and subsistence diets.
This article was written by Owen Mulhern.
Why This Metric?
A February 2021 study, published in the Journal of Geophysical Research Letters, reported that seasons in the Northern Hemisphere are now changing lengths, all except summer becoming shorter.
They found that over a 60 year period, from 1952 to 2011, winters, springs and autumns shortened together by an average 17 days, which summer assimilated for itself. Modelling revealed that it could become another 12 days longer by mid-century, and 4 to 6 months long by 2100.
Exploring the Metric
Our natural world is built around biological clocks. The body’s rhythm changes between night and day, and many animals, insects and plants depend on seasonal cues. Longer summers have the potential to throw these systems out of whack.
The effect on wildlife has already been observed: pollinators emerge out of sync with plant blooms they rely on for reproduction, threatening both parties. An exceptionally warm “false spring” in March 2012 lured vegetation out of dormancy before temperatures dropped again in April, killing many crops.
But it isn’t only early onsets and length, summers are also getting hotter. There’s a high probability that future generations will face up to 6 times more extreme heat events than ours, and up to 3 billion people could face temperatures beyond human tolerance by 2070. Some scientists have even warned that disease-carrying mosquitoes could expand their range both polewards and elevation-wise thanks to warmer nights. Along with this, scientists expect more droughts and floods, and an acceleration to sea level rise.
Where the Numbers Come From
The authors of the paper, Changing Lengths of the Four Seasons by Global Warming, looked through daily climate data from 1952 to 2011 and defined the start of summer as the onset of temperatures in the hottest 25% during that period. Conversely, winter was defined as the onset of the 25% coldest.
Future Outlook
Governments should take stock of this information and prepare accordingly. Potential mosquito range increases have been modelled, and preventive measures need to be taught and promoted among the newly vulnerable populations.
Agriculture is also an area to keep an eye on. Freakish extremes happen and can be dealt with, but baseline changes could mean rethinking what crops are best suited to new weather patterns, and how infrastructure can be adapted.
As for summers becoming lethally hot, our actions now will determine the onset. Significant cuts in greenhouse gas emissions will buy time to adapt to or even avoid catastrophic levels of global warming.
This article was written by Owen Mulhern.
Biodiversity loss and the ecological crisis have become hot topics in recent years but why does the loss of biological diversity matter to humans and what problems could we be facing as this crisis escalates? Here, we explore some of the ways in which losing biodiversity could impact our lives.
—
Biodiversity loss describes the loss of life on Earth at different levels from reductions in genetic diversity to the collapse of entire ecosystems. In addition to its intrinsic value, biodiversity underpins ecosystem services which provide the backbone of the global economy.
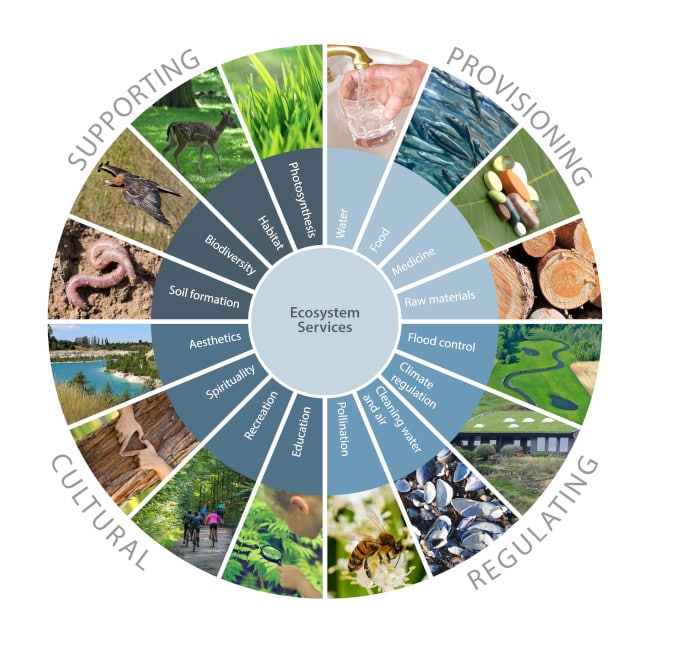
Ecosystem services are the natural processes provided by healthy ecosystems that provide a wide range of benefits to humans. Ecosystem services include the benefits of pollination provided by animals or the natural processes that recycle nutrients to support the formation of fertile soils which allow for greater crop yields. Cultural ecosystem services are also provided, for example, through the aesthetic value of nature which can generate money via ecotourism as well as improving people’s mental health.
Processing and long-range transport dissociates the products from their place of origin, so it is easy for us to forget that rampant ecological destruction and biodiversity loss is unsustainable if humans are to survive. What we take for granted now can disappear from one day to the other, as COVID-19 showed the world.
Source: Aarhus University, Department of Environmental Science.
A paper led by Robert Costanza in 1997 calculated that the global value of ecosystem services is US$33 trillion annually which is similar to the total global GDP at that time.
Biodiversity and these ecosystem services can be lost through human activities such as land use changes and because these services are often not assigned a direct economic value, they can be degraded to generate short-term economic gains. Eroding these services by losing biodiversity leads to an unsustainable economy and leaves communities with reduced health and well-being standards, therefore, halting the loss of biodiversity is essential for preventing a crash in the global economy and preventing tensions and conflicts from arising within society.
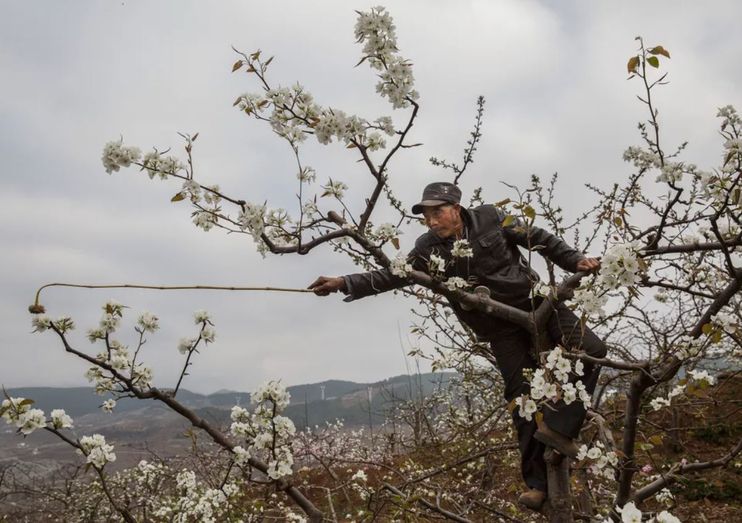
A startling example illustrating how the loss of biodiversity can lead to the dissolution of ecosystem services can be seen in the apple and pear orchards of Sichuan, China where the loss of insect pollinator diversity has meant the trees must now be hand pollinated. The absence of pollinators here has been caused by the destruction of pollinator habitat and the overuse of pesticides that are toxic to insect pollinators. As a consequence, labourers in this region are armed with a paintbrush and a pot of pollen and must pollinate each individual flower by hand which may not always be an economically viable solution due to the rising cost of labour and declining fruit yields.
The higher concentration of biodiversity in warm, low-latitude regions means the value of ecosystem services tends to be greatest here, despite many of the countries in these regions being economically some of the poorest. For example, coral reefs grow in low-latitude, tropical regions and support enormous amounts of biodiversity which provides ecosystem services with a global value of US$9.9 trillion annually.
A 2013 report by The World Bankstated that people living in poverty are around 20% more likely than the global average to live in rural regions and are 22% more likely to be working in agriculture, mostly through smallholder farming. This way of life is highly reliant on the healthy functioning of ecosystem services to provide high crop yields and it is likely that these people would lack the technology to overcome the new challenges from losing these natural services.
This raises issues of environmental justice, as a disproportionate fraction of the activities leading to the global degradation of ecosystem services is caused by wealthy, developed nations. For example, 79% of historical carbon dioxide emissionshave come from developed countries and these greenhouse gas emissions increase the frequency and severity of floods and droughts globally which can dramatically reduce crop yields.
It is clear that a new international framework of regulations needs to be imposed to bring to a halt the unprecedented loss of biodiversity and protect the ecosystem services that provide the foundations for human civilisation. Fines and financial incentives need to be imposed to put an economic value on nature and developed nations have a responsibility to funnel resources to poorer regions to help them conserve ecosystems which will pave the way to a more sustainable and just future.
This article was written by Sammy Witchalls. Cover photo by S N Pattenden on Unsplash.
biodiversity loss can affect humans, biodiversity loss humans
We are partially aware that the plastic we use on a daily basis, half of which is single use, has to go somewhere. Similarly, we know a lot ends up in the ocean, but its impacts are, for the most part, out of sight and out of mind. It is important to realise our plastic reliance is wreaking havoc underwater, killing or crippling marine animals. How many marine animals die from plastic each year and what are the main threats?
—
In 2018, a juvenile sperm whale was found dead on a beach in Spain; its digestive tract contained just under 30 kilograms of plastic.
Source: (Twitter: Espacios Naturales Murcia)
The cause of death was inflammation from these many pieces, all coated in various toxins, probably causing huge suffering to the poor animal.
We find about 100,000 marine animals killed by ocean plastic ingestion or entanglement each year, and this is only the tip of the iceberg. There are likely far more lying at the bottom of the ocean, who, once decomposed, will release the plastic for other animals to encounter. Approximately 1 million sea birds also die from plastic annually, and it remains to be seen what the toll is on humans, who ingest approximately 40 pounds during their lifetime.
All of the above is unsurprising once we understand the sheer quantity of plastic in the ocean. About 8 to 10 million tons make their way into the water every year, and we believe there are over 46,000 pieces of plastic in every square mile of ocean. Every single day, 13,000 to 15,000 pieces of plastic are dumped in – it’s unfathomable.
Ocean plastic map by count of pieces. Arrangement goes from left to right, top to bottom, smallest (0.33 – 1.00 mm) to biggest (>200 mm) pieces. Source: Eriksen et al. (2014).
What Kills Marine Animals?
For marine animals that rely on eyesight, ocean plastic might appear worth a nibble, and you can probably picture a ballooning plastic bag looking like a squid. For others, like the whales and dolphins that use echolocation to find their prey, it is probably even more confusing. Their multi-million year old sonar system hasn’t had time to adjust to the century-old concept of plastic, and there’s a chance it never will.
Entanglement
Beyond the many deaths are the many crippled, caught in abandoned “ghost” fishing lines that are either carelessly or intentionally left behind. Common victims are dolphins, sea turtles, sharks, whales and sea lions.
Worse yet, like I, you may have overlooked that marine mammals cannot breathe underwater, and getting ensnared in nets can actually drown them.
What You Can Do
A recent study found that nearly 50% of ocean plastics come from takeout, with a higher proportion in lower-income countries. We have far more agency than we think in stemming the tide of plastic, and it starts with education. We are thankful you’ve read so far and hope you will share this with those around you, but beyond this, talk about where you can. Each incremental step is needed to change the collective conscience.
The advent of satellite technology has allowed us to monitor the state of the cryosphere for four decades. It has become clear that both Arctic glaciers and sea ice are dwindling proportionally to atmospheric warming, disrupting a 12,000 year equilibrium.
The arctic has warmed well over twice the average global pace, resulting in more sea ice melt than expected. There are a few ways to measure this, but the main method is by monitoring sea ice extent, or the oceanic area with at least 15% ice cover. Sea Ice extent hit record lows in summer 2012, summer 2019 being the runner-up. The 13 worst years for Arctic sea ice came in the last 13 years, and in 2021, its summer extent was 7.4% lower than the historical average.
Losing ice has multiple side-effects. The first and most obvious is sea level rise, which has been accelerating and could reach 1 to 2 meters by the end of the century. Second, white surfaces help reflect sunlight into space and keep the planet cool, so ice loss increases warming, creating a feedback loop. Darker waters in the Arctic also absorb more heat. Scientists expect ice free summers could arise as early as 2035 as the system tips toward runaway melt.
As sea ice disappears, nations prepare to capitalize on new shipping routes, fishing zones, fossil fuel exploration and military activity in northern waters. However, as this develops, walruses and polar bears will lose their habitats, and the warm-weather jetstream will weaken, potentially altering European weather for centuries to come.
Over 100 countries signed an agreement to cut methane emissions by at least 30% by 2030, though the three largest emitters, India, Russia and China, did not join. Here, we explain why the agreement was such as important one, and how it could seriously curtail short-term global warming.
—
We’d freeze to death without the greenhouse effect (or just not exist at all), but thanks to heat-trapping molecules in the atmosphere, we live in an agreeable 14C average-temperature world.
Unfortunately, it so happens that the fossilized carbon fuels we use to drive our engines also release greenhouse gases, slowly but surely disrupting the benign 12,000 year climate that allowed humans to thrive.
Carbon dioxide is seen as the most important of these gases, despite it absorbing less heat per molecule than most of the others. This is because it lingers in our atmosphere for centuries longer, therefore committing us and the next generations to more warming.
We now find ourselves running out of precious time to meet the Paris Agreement’s goal of staying under 1.5C, a threshold we will probably cross within a decade. The carbon dioxide we’ve emitted might already be enough to take us past it, if not within 10 years, then within the centuries it has left up there.
This is why the international community has ended its tunnel-vision on CO2 and brought the Global Methane Pledge to life with 103 signees. Methane has been increasing just as relentlessly as CO2, with a higher potential to snowball out of control.
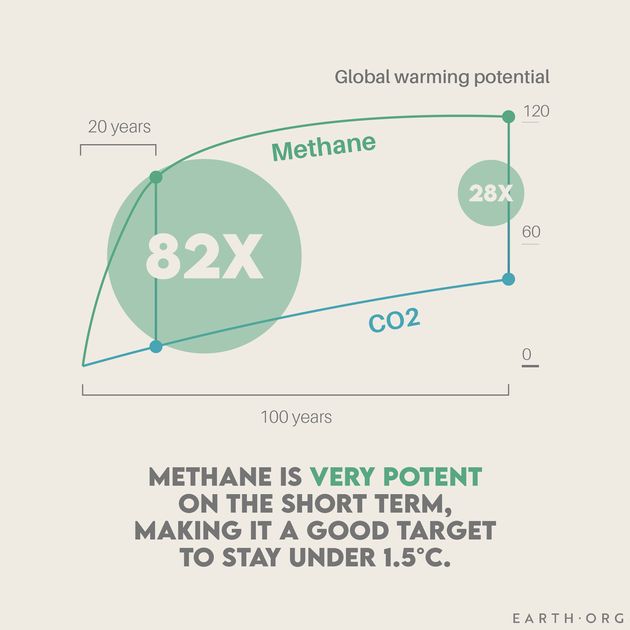
It is commonly described as having 28-34 times the warming potential of CO2, but this is a little misleading. With a 12-15 year lifespan, methane traps around 80 times the heat CO2 does over 20 years, dropping to 28-34 times over a century, the standard timescale.
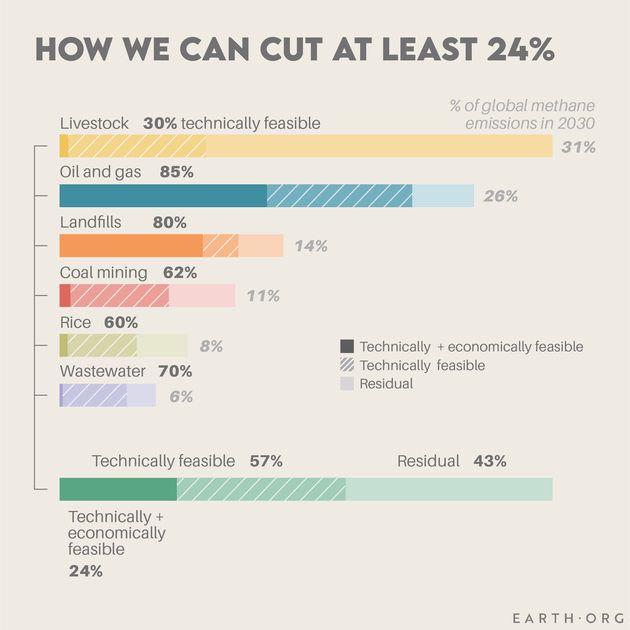
Indeed, limiting methane emissions could be an excellent solution to effectively curtail short-term warming. A recent study led by Ilissa Ocko of the Environmental Defense Fund found that there are many available, yet underutilized strategies to reduce methane emissions throughout a range of industries.
According to them, pursuing all of the technically feasible measures now could slow warming by 30% in the next decade. On geological timescales, that is near-immediate impact, and the authors argue it is far preferable to the current focus on long-term, carbon-centered policies.
In fact, action towards limiting methane emissions is likely to be slowed or delayed while decarbonization and net-zero are given priority, despite the former’s feasibility and the latter’s unclear outcome.
Admittedly, methane has benefited from a lack of visibility to escape governmental action. In the oil and gas industry, its emissions are often fugitive, unintentionally leaked out of fossil fuel infrastructure and poorly quantified. Similarly, those from landfills are significant, yet poorly monitored.
If crude measurement techniques were to blame, satellite technology has come and changed the game. Academic, private and non-governmental organizations can now access a literal eye in the sky to flag undeclared or underestimated methane sources.
Researchers from Harvard found that emissions in Texas and New Mexico were twice government figures, while the french satellite analysis company Kayrros SAS flagged a huge methane leak from a Russian pipeline owned by Gazprom just a few weeks ago.
Armed with these tools, governments have everything they need to take decisive action. The payoff is a potential 0.2°C less warming by 2050, which could give many vulnerable nations a much needed reprieve as they adapt to climate change.
Boost this article
By donating us $100, $50 or subscribe to Boosting $10/month – we can get this article and others in front of tens of thousands of specially targeted readers. This targeted Boosting – helps us to reach wider audiences – aiming to convince the unconvinced, to inform the uninformed, to enlighten the dogmatic.