Sign Up
Earth.Org Newsletters

Sign up to our weekly easy-to-digest recap of climate news from around the world.

Earth.Org PAST · PRESENT · FUTURE

Sea level rise is 2 to 3 times faster around Nauru than the global average, putting its freshwater supplies and crops at risk of saltwater contamination.  Already reliant on economical aid, its basic resource needs may have to acquired externally for life to be sustained on the island. 

Earth.Org take a closer look. 

—

Nauru, once a wealthy nation, is now threatened by climate change. The total land area is only 21 km2 with just over 10,000 residents. Large boats cannot access the island due to a barrier of coral around its shores. The only fertile areas are on its narrow coastal belt where coconut palms grow, or around the Buada lagoon that can support bananas and pineapples. Moreover, freshwater resources are very limited, mostly coming from the lagoon, rooftop storage tanks, and three desalination plants. 

Inland, 80% of the area has been ravaged as a result of heavy phosphate mining. Once the phosphate resources were depleted, Nauru briefly became a tax haven and illegal money laundering center, after which it accepted aid from the Australian Government in exchange for hosting an immigration detention facility. 

Water is rising rapidly around Nauru, and a vulnerability assessment stated that the projected sea level rise could soon contaminate the groundwater supply by saltwater intrusion. Buada Lagoon, the only surface freshwater resource, is located in the low-lying Southwest-central portion of the island only 5 metres above sea-level, exposed to strong storm surges. Moreover, the majority of the infrastructure and socio-economic activities in Nauru are located near or on the coast, with homes, ports and hospitals vulnerable to flood damage. 

As a call for awareness, we’ve modelled floods on Nauru by 2100, along with temporary population displacement.

sea level rise by 2100 nauru

Sea level rise projections by 2100 for two scenarios with the amount of rise in meters indicated (mild = 2m; extreme = 4m). Percentage and total population displacement indicated bottom right.

Methodology

Global mean sea level is projected to rise by 2m at the end of this century. However, in order to determine local sea level rise (SLR), one has to take into account local coastal flood levels which could be 2.8m above Mean Higher-High Water (MHHW) at extreme forecasts. These local levels bring variability to the projected SLR from 1m to 6.5m (eg. Rio vs Kolkata).

The SLR scenarios used in this study are based on the forecasts from Climate Central – Coastal Risk Screening Tool  with the following parameters:

  • Sea level Projection Source
  • Coastal Flood Level
  • Pollution Scenario
  • Luck

Sea level Projection Source:

From two highly cited journals by Kopp et al., estimating SLR mainly due to ocean thermal expansion and ice melt. The mid-range scenario projected 0.5-1.2m of SLR based on different representative concentration pathways (RCP) defined by the IPCC. While the pessimistic scenario added more mechanisms of ice-sheet melting, estimating SLR at 1m-2.5m in 2100, with a projection of 10m SLR at 2300.

Coastal Flooding

More frequent coastal flooding is a direct impact of sea-level rise. Based on the Global tides and surge reanalysis by Muis et al., (2016), it is estimated that the extreme coastal water level could be from 0.2 – 2.8m over the mean level. While in extreme cases like China and the Netherlands it could experience 5-10m of extreme sea levels. Here, the coastal local flood level is added on top of the projected SLR.

Pollution Scenario:

Allows choosing the RCP, the greenhouse gas concentration trajectory defined by the IPCC.  The mild level is based on RCP4.5, of 2°C temperature rise; while the Extreme level is based on RCP 8.5, of 4°C temperature rise.

Luck:

Applies to the baseline SLR, defined in the “Sea level projection” section, upon which we add flooding. “Mild” refers to the mid-range scenario of 0.5-1.2m, and “extreme” to the pessimistic scenario of 1-2.5m. We used the high-end value of each scenario (mild = 1m; extreme = 2.5m).

Mapping and methodology by Braundt Lau. Article written by Wing Ki Leung and Owen Mulhern.

You might also like: Sea Level Rise by 2100 – Miami


References:

  • Kulp, Scott A., and Benjamin H. Strauss. “New elevation data triple estimates of global vulnerability to sea-level rise and coastal flooding.” Nature communications 10.1 (2019): 1-12.
  • Florczyk, A. J., Corbane, C., Ehrlich, D., Freire, S., Kemper, T., Maffenini, L., Melchiorri, M., Politis, P., Schiavina, M., Sabo, F. & Zanchetta, L. (2019). GHSL Data Package 2019 Public Release.
  • Kopp, R. E., DeConto, R. M., Bader, D. A., Hay, C. C., Horton, R. M., Kulp, S., Oppenheimer, M., Pollard, D. & Strauss, B. H. (2017). Evolving Understanding of Antarctic Ice-Sheet Physics and Ambiguity in Probabilistic Sea-Level Projections. Earth’s Future, 5(12), 1217–1233.
  • Kopp, R. E., Horton, R. M., Little, C. M., Mitrovica, J. X., Oppenheimer, M., Rasmussen, D. J., Strauss, B. H. & Tebaldi, C. (2014). Probabilistic 21st and 22nd Century Sea-Level Projections at a Global Network of Tide-Gauge Sites. Earth’s Future, 2(8), 383–406.
  • Kulp, S. A. & Strauss, B. H. (2019). New Elevation Data Triple Estimates of Global Vulnerability to Sea-Level Rise and Coastal Flooding. Nature Communications, 10(1), 4844. Retrieved June 21, 2020, from http://www.nature.com/articles/s41467-019-12808-z
  • Muis, S., Verlaan, M., Winsemius, H. C., Aerts, J. C. J. H. & Ward, P. J. (2016). A Global Reanalysis of Storm Surges and Extreme Sea Levels. Nature Communications, 7.
Miami is notoriously vulnerable to sea level rise, and its mayor has been vocal about the looming dangers of climate change in a relatively skeptical political environment. Mitigation plans involve massive engineering feats that may help in the short-term, but will eventually be overrun.

Earth.Org takes a closer look.

—

A major centre of finance, commerce, culture, arts and trade, Miami is a global city with a USD $345 billion GDP. Built on a broad, low-lying plain between Everglades wetlands and Biscayne Bay, its citizens are already experiencing early signs of climate change.

Why?

Since 1870, global sea levels have risen by an average of 20 cm, but Southeast Florida’s local levels have risen by 30 cm. By 2060, it could double or triple that. 

The impacts of sea level rise in Miami

  • Prolonged flooding after storms calls for a renovation of the city’s drainage system, which would cost USD $206 million. 
  • Beaches are eroding and domestic sand resources are dwindling. The Army Corps of Engineers estimated that the equivalent of 10,781 football fields covered in 30 cm of sand would be necessary to sustain Miami’s beaches for the next 50 years.
  • Hurricane-driven storm surges (of which there were 8 between 2004 and 2005 alone) will chrome 3 times as likely at 30 cm sea level rise, and 15 times more at 60 cm.
  • Porous limestone ground makes seawalls incapable of stopping salt water from infiltrating aquifers, negatively impacting agriculture and drinking water reserves.
  • Water rise of only 10 to 35 cm would be sufficient to reduce 70% of Miami’s coastal flood control drainage capacity. 

In light of the last point, officials have decided to build a network of huge pumps that force water out of flood-prone areas and into Biscayne Bay. There are over 30 pumps today, with 90 planned in total. The estimated cost for 3 pumps, including land acquisition, is USD $ 200 million. Unfortunately, even all 90 cannot protect the larger Miami area. 

The city of Miami still toils away to mitigate flooding, raising roads and buildings, hoping to buy time. The world would do well to keep an eye on how Miami fares, as it may be the first major victim of climate change.

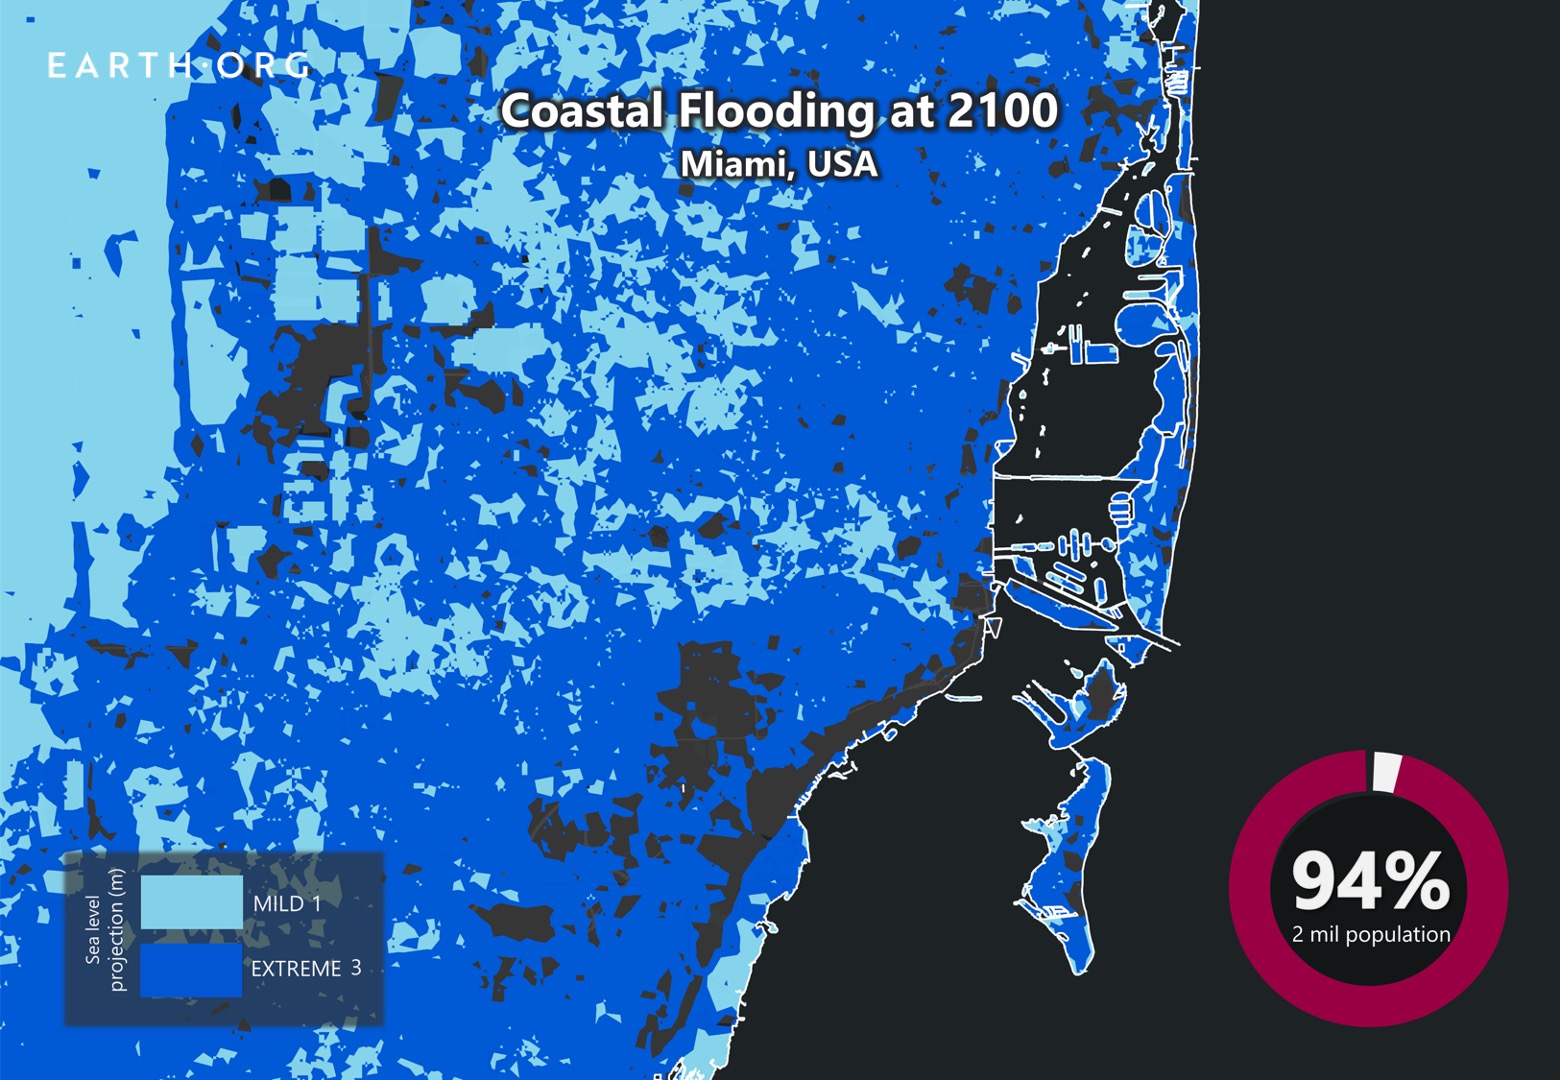
Earth.Org has mapped severe flooding in southern Florida by the end of the century to illustrate the impending danger.

Sea Level Rise: Miami’s Map

sea level rise by 2100 miami

Sea level rise projections by 2100 for two scenarios with the amount of rise in meters indicated (mild = 1m; extreme = 4m). Percentage and total population displacement indicated bottom right, yellow star on the city of Miami.

Methodology

Global mean sea level is projected to rise by 2m at the end of this century. However, in order to determine local sea level rise (SLR), one has to take into account local coastal flood levels which could be 2.8m above Mean Higher-High Water (MHHW) at extreme forecasts. These local levels bring variability to the projected SLR from 1m to 6.5m (eg. Rio vs Kolkata).

The SLR scenarios used in this study are based on the forecasts from Climate Central – Coastal Risk Screening Tool  with the following parameters:

  • Sea level Projection Source
  • Coastal Flood Level
  • Pollution Scenario
  • Luck

Sea level Projection Source:

From two highly cited journals by Kopp et al., estimating SLR mainly due to ocean thermal expansion and ice melt. The mid-range scenario projected 0.5-1.2m of SLR based on different representative concentration pathways (RCP) defined by the IPCC. While the pessimistic scenario added more mechanisms of ice-sheet melting, estimating SLR at 1m-2.5m in 2100, with a projection of 10m SLR at 2300.

Coastal Flooding

More frequent coastal flooding is a direct impact of sea-level rise. Based on the Global tides and surge reanalysis by Muis et al., (2016), it is estimated that the extreme coastal water level could be from 0.2 – 2.8m over the mean level. While in extreme cases like China and the Netherlands it could experience 5-10m of extreme sea levels. Here, the coastal local flood level is added on top of the projected SLR.

Pollution Scenario:

Allows choosing the RCP, the greenhouse gas concentration trajectory defined by the IPCC.  The mild level is based on RCP4.5, of 2°C temperature rise; while the Extreme level is based on RCP 8.5, of 4°C temperature rise.

Luck:

Applies to the baseline SLR, defined in the “Sea level projection” section, upon which we add flooding. “Mild” refers to the mid-range scenario of 0.5-1.2m, and “extreme” to the pessimistic scenario of 1-2.5m. We used the high-end value of each scenario (mild = 1m; extreme = 2.5m).

You might also like: Sea Level Rise by 2100 – New York City

References:
  • Kulp, Scott A., and Benjamin H. Strauss. “New elevation data triple estimates of global vulnerability to sea-level rise and coastal flooding.” Nature communications 10.1 (2019): 1-12.
  • Florczyk, A. J., Corbane, C., Ehrlich, D., Freire, S., Kemper, T., Maffenini, L., Melchiorri, M., Politis, P., Schiavina, M., Sabo, F. & Zanchetta, L. (2019). GHSL Data Package 2019 Public Release.
  • Kopp, R. E., DeConto, R. M., Bader, D. A., Hay, C. C., Horton, R. M., Kulp, S., Oppenheimer, M., Pollard, D. & Strauss, B. H. (2017). Evolving Understanding of Antarctic Ice-Sheet Physics and Ambiguity in Probabilistic Sea-Level Projections. Earth’s Future, 5(12), 1217–1233.
  • Kopp, R. E., Horton, R. M., Little, C. M., Mitrovica, J. X., Oppenheimer, M., Rasmussen, D. J., Strauss, B. H. & Tebaldi, C. (2014). Probabilistic 21st and 22nd Century Sea-Level Projections at a Global Network of Tide-Gauge Sites. Earth’s Future, 2(8), 383–406.
  • Kulp, S. A. & Strauss, B. H. (2019). New Elevation Data Triple Estimates of Global Vulnerability to Sea-Level Rise and Coastal Flooding. Nature Communications, 10(1), 4844. Retrieved June 21, 2020, from http://www.nature.com/articles/s41467-019-12808-z
  • Muis, S., Verlaan, M., Winsemius, H. C., Aerts, J. C. J. H. & Ward, P. J. (2016). A Global Reanalysis of Storm Surges and Extreme Sea Levels. Nature Communications, 7.

The islands of Tuvalu, scattered over 500,000 square miles of ocean between Hawaii and Australia. It is densely populated and generally less than 3 m above sea level. New predictions of 1 to 2 m sea level rise by 2100 put the archipelago in serious danger of becoming uninhabitable. 

Earth.Org has mapped extreme flooding in Tuvalu by the end of the century as a call to curb emissions. 

—

Tuvalu is made up of nine tiny islands in the southwest Pacific, with a total landmass of just 10 square miles and highest point of 4.5 metres above sea level. Its population density is higher than that of Japan at 379 people per km2, and the low topology puts all of its 11,000 inhabitants at risk flooding from storm surges or even tsunamis. 

In 2000, the country was involved in a climate change controversy. The National Tidal Centre (NTC) claimed that after seven years of measurements, the sea level at Funafuti, the capital of the country, had actually fallen by 86.9 mm since 1993. This put all the climate change plans by the Tuvaluan government on hold. After reanalysis of NTC’s records in combination with other data, it was found that sea level at Funafuti was, in fact, rising at a similar rate as the global mean. In 2003, the data from the Funafuti station showed that sea level has risen there an average of 5.6 mm annually over the past decade.

As of today, there are no major forms of flood control, be it sea walls or relocation plans. Earth.Org has mapped the worst-case scenario floods on Tuvalu by 2100 to illustrate the need for action. 

sea level rise by 2100 tuvalu

Sea level rise projections by 2100 for two scenarios with the amount of rise in meters indicated (mild = 2m; extreme = 4m). Population displacement indicated bottom right.

Methodology

Global mean sea level is projected to rise by 2m at the end of this century. However, in order to determine local sea level rise (SLR), one has to take into account local coastal flood levels which could be 2.8m above Mean Higher-High Water (MHHW) at extreme forecasts. These local levels bring variability to the projected SLR from 1m to 6.5m (eg. Rio vs Kolkata).

The SLR scenarios used in this study are based on the forecasts from Climate Central – Coastal Risk Screening Tool  with the following parameters:

  • Sea level Projection Source
  • Coastal Flood Level
  • Pollution Scenario
  • Luck

Sea level Projection Source

From two highly cited journals by Kopp et al., estimating SLR mainly due to ocean thermal expansion and ice melt. The mid-range scenario projected 0.5-1.2m of SLR based on different representative concentration pathways (RCP) defined by the IPCC. While the pessimistic scenario added more mechanisms of ice-sheet melting, estimating SLR at 1m-2.5m in 2100, with a projection of 10m SLR at 2300.

Coastal Flooding

More frequent coastal flooding is a direct impact of sea-level rise. Based on the Global tides and surge reanalysis by Muis et al., (2016), it is estimated that the extreme coastal water level could be from 0.2 – 2.8m over the mean level. While in extreme cases like China and the Netherlands it could experience 5-10m of extreme sea levels. Here, the coastal local flood level is added on top of the projected SLR.

Pollution Scenario

Allows choosing the RCP, the greenhouse gas concentration trajectory defined by the IPCC.  The mild level is based on RCP4.5, of 2°C temperature rise; while the Extreme level is based on RCP 8.5, of 4°C temperature rise.

Luck

Applies to the baseline SLR, defined in the “Sea level projection” section, upon which we add flooding. “Mild” refers to the mid-range scenario of 0.5-1.2m, and “extreme” to the pessimistic scenario of 1-2.5m. We used the high-end value of each scenario (mild = 1m; extreme = 2.5m).

Mapping and methodology by Braundt Lau. Article written by Wing Ki Leung and Owen Mulhern.

You might also like: Sea Level Rise by 2100 – Miami


References:
  • Kulp, Scott A., and Benjamin H. Strauss. “New elevation data triple estimates of global vulnerability to sea-level rise and coastal flooding.” Nature communications 10.1 (2019): 1-12.
  • Florczyk, A. J., Corbane, C., Ehrlich, D., Freire, S., Kemper, T., Maffenini, L., Melchiorri, M., Politis, P., Schiavina, M., Sabo, F. & Zanchetta, L. (2019). GHSL Data Package 2019 Public Release.
  • Kopp, R. E., DeConto, R. M., Bader, D. A., Hay, C. C., Horton, R. M., Kulp, S., Oppenheimer, M., Pollard, D. & Strauss, B. H. (2017). Evolving Understanding of Antarctic Ice-Sheet Physics and Ambiguity in Probabilistic Sea-Level Projections. Earth’s Future, 5(12), 1217–1233.
  • Kopp, R. E., Horton, R. M., Little, C. M., Mitrovica, J. X., Oppenheimer, M., Rasmussen, D. J., Strauss, B. H. & Tebaldi, C. (2014). Probabilistic 21st and 22nd Century Sea-Level Projections at a Global Network of Tide-Gauge Sites. Earth’s Future, 2(8), 383–406.
  • Kulp, S. A. & Strauss, B. H. (2019). New Elevation Data Triple Estimates of Global Vulnerability to Sea-Level Rise and Coastal Flooding. Nature Communications, 10(1), 4844. Retrieved June 21, 2020, from http://www.nature.com/articles/s41467-019-12808-z
  • Muis, S., Verlaan, M., Winsemius, H. C., Aerts, J. C. J. H. & Ward, P. J. (2016). A Global Reanalysis of Storm Surges and Extreme Sea Levels. Nature Communications, 7.

Palau is a small nation with exceptional biodiversity in the western Pacific Ocean. It has one of the largest tropical rainforests in Micronesia and is home to around 1,260 species. However, sea level rise is a big threat for the nation, and humans and animals alike are losing ground fast. 

Earth.Org has mapped what extreme flooding could look like on Palau by 2100 as a call for global awareness.

—

Palau is the westernmost island cluster in the Caroline Island Group. 25% of the nation’s landmass lies below 10 m above sea level and only 12 out of 586 islands of the archipelago are continuously inhabitable, with roughly 180,000 citizens in total. 

Low emissions projections by 2090 put sea level rise in Palau at 15 to 46 cm, medium emissions at 18 to 59 cm, and high emissions at 21 to 61 cm. Despite most of Palau standing 9 m above sea level, most of the high ground is hilly and thickly forested, unfavorable for human habitation and economic activity. Like most island states, Palau relies heavily on its coastline for its way of life. 

Examples like the December 2008 floods that occurred from coastal flooding only (no downpour), highlight Palau’s vulnerability. It was a combination of the highest tide of the year, sea level rise and larger waves from a distant storm. Infrastructure was damaged, communities flooded and fresh water aquifers contaminated with salt. Approximately 60% of the island’s crops were destroyed. The probability of this kind of event occurring increases with each centimeter of sea level rise, becoming too costly to endure past a certain point. 

The truth is that reversing the process is impossible, but mitigating it enough to give time to vulnerable countries and the rest of the world to adapt is key.  

Earth.Org has modelled what a mild and extreme flooding event could look like in Palau by 2100 under a high emissions scenario to illustrate the need for action.

sea level rise by 2100 palau

Sea level rise projections by 2100 for two scenarios with the amount of rise in meters indicated (mild = 1m; extreme = 3m). Population displacement indicated bottom right.

Methodology

Global mean sea level is projected to rise by 2m at the end of this century. However, in order to determine local sea level rise (SLR), one has to take into account local coastal flood levels which could be 2.8m above Mean Higher-High Water (MHHW) at extreme forecasts. These local levels bring variability to the projected SLR from 1m to 6.5m (eg. Rio vs Kolkata).

The SLR scenarios used in this study are based on the forecasts from Climate Central – Coastal Risk Screening Tool  with the following parameters:

  • Sea level Projection Source
  • Coastal Flood Level
  • Pollution Scenario
  • Luck

Sea level Projection Source

From two highly cited journals by Kopp et al., estimating SLR mainly due to ocean thermal expansion and ice melt. The mid-range scenario projected 0.5-1.2m of SLR based on different representative concentration pathways (RCP) defined by the IPCC. While the pessimistic scenario added more mechanisms of ice-sheet melting, estimating SLR at 1m-2.5m in 2100, with a projection of 10m SLR at 2300.

Coastal Flooding

More frequent coastal flooding is a direct impact of sea-level rise. Based on the Global tides and surge reanalysis by Muis et al., (2016), it is estimated that the extreme coastal water level could be from 0.2 – 2.8m over the mean level. While in extreme cases like China and the Netherlands it could experience 5-10m of extreme sea levels. Here, the coastal local flood level is added on top of the projected SLR.

Pollution Scenario

Allows choosing the RCP, the greenhouse gas concentration trajectory defined by the IPCC.  The mild level is based on RCP4.5, of 2°C temperature rise; while the Extreme level is based on RCP 8.5, of 4°C temperature rise.

Luck

Applies to the baseline SLR, defined in the “Sea level projection” section, upon which we add flooding. “Mild” refers to the mid-range scenario of 0.5-1.2m, and “extreme” to the pessimistic scenario of 1-2.5m. We used the high-end value of each scenario (mild = 1m; extreme = 2.5m).

Mapping and methodology by Braundt Lau. Article written by Wing Ki Leung and Owen Mulhern.

You might also like: Sea Level Rise by 2100 – Maldives


References:
  • Kulp, Scott A., and Benjamin H. Strauss. “New elevation data triple estimates of global vulnerability to sea-level rise and coastal flooding.” Nature communications 10.1 (2019): 1-12.
  • Florczyk, A. J., Corbane, C., Ehrlich, D., Freire, S., Kemper, T., Maffenini, L., Melchiorri, M., Politis, P., Schiavina, M., Sabo, F. & Zanchetta, L. (2019). GHSL Data Package 2019 Public Release.
  • Kopp, R. E., DeConto, R. M., Bader, D. A., Hay, C. C., Horton, R. M., Kulp, S., Oppenheimer, M., Pollard, D. & Strauss, B. H. (2017). Evolving Understanding of Antarctic Ice-Sheet Physics and Ambiguity in Probabilistic Sea-Level Projections. Earth’s Future, 5(12), 1217–1233.
  • Kopp, R. E., Horton, R. M., Little, C. M., Mitrovica, J. X., Oppenheimer, M., Rasmussen, D. J., Strauss, B. H. & Tebaldi, C. (2014). Probabilistic 21st and 22nd Century Sea-Level Projections at a Global Network of Tide-Gauge Sites. Earth’s Future, 2(8), 383–406.
  • Kulp, S. A. & Strauss, B. H. (2019). New Elevation Data Triple Estimates of Global Vulnerability to Sea-Level Rise and Coastal Flooding. Nature Communications, 10(1), 4844. Retrieved June 21, 2020, from http://www.nature.com/articles/s41467-019-12808-z
  • Muis, S., Verlaan, M., Winsemius, H. C., Aerts, J. C. J. H. & Ward, P. J. (2016). A Global Reanalysis of Storm Surges and Extreme Sea Levels. Nature Communications, 7.

The impact of climate change has constantly reshaped the coastlines of Abu Dhabi. As the sea level continues to rise, by 2100, the coastlines are estimated to retreat by 2.26 to 3.81 kilometres.

Earth.Org has mapped the effect of severe flooding on Abu Dhabi by 2100.

—

Abu Dhabi is the United Arab Emirates’ second-most populous city after Dubai, and its center for politics and industry. Most of Abu Dhabi’s population and commercial and cultural activity is concentrated on its coastline, putting the bulk of its assets at risk from sea level rise. 

When looking at our climate by the end of the century, there is uncertainty. Temperatures could increase by 1.4 to 5.8°C and sea levels could rise by 0.5 to 2 m. However, the most recent IPCC assessment has shown that the more we learn, the worse the situation appears. It would be wise for governments to prepare for the more extreme scenarios, and begin to seriously curb emissions.

In the case of Abu Dhabi, a sea level rise risk assessment study was conducted in 2012, where the authors estimated the proportion of urban area lost to the ocean for different scenarios. A half-meter rise would submerge 1.46% of the city, quickly jumping up to 9.45% and 15.89% for a 1.5 and 2 m rise respectively. The costs have not been precisely estimated, but considering Abu Dhabi’s economic importance (accounting for two-thirds of the UAE’s  US $400 billion economy), the damage could be in the billions of US dollars. 

The impacts of rising waters could also have grave effects on the neighboring ecosystems, such as the precious mangrove forests. These coastal trees help soften the impacts of storms and floods, prevent erosion thanks to their roots, and trap large amounts of carbon. Unfortunately, they could be submerged, moving their ideal water depth further inland at a speed the ecosystem could not keep up with. 

Despite an awareness of the mangrove’s value and the danger climate change poses, the United Arab Emirates remains one of the highest CO2 emitting countries per capita in the world. The facts are in front of them, and hoping for a mild future rather than assuming a worst-case scenario is now illogical. 

Earth.Org has mapped severe flooding in Abu Dhabi by 2100 as a call to action. 

sea level rise by 2100 abu dhabi

Sea level rise projections by 2100 for two scenarios with the amount of rise in meters indicated (mild = 1m; extreme = 3m). Population displacement indicated bottom right.

Methodology

Global mean sea level is projected to rise by 2m at the end of this century. However, in order to determine local sea level rise (SLR), one has to take into account local coastal flood levels which could be 2.8m above Mean Higher-High Water (MHHW) at extreme forecasts. These local levels bring variability to the projected SLR from 1m to 6.5m (eg. Rio vs Kolkata).

The SLR scenarios used in this study are based on the forecasts from Climate Central – Coastal Risk Screening Tool  with the following parameters:

  • Sea level Projection Source
  • Coastal Flood Level
  • Pollution Scenario
  • Luck

Sea level Projection Source

From two highly cited journals by Kopp et al., estimating SLR mainly due to ocean thermal expansion and ice melt. The mid-range scenario projected 0.5-1.2m of SLR based on different representative concentration pathways (RCP) defined by the IPCC. While the pessimistic scenario added more mechanisms of ice-sheet melting, estimating SLR at 1m-2.5m in 2100, with a projection of 10m SLR at 2300.

Coastal Flooding

More frequent coastal flooding is a direct impact of sea-level rise. Based on the Global tides and surge reanalysis by Muis et al., (2016), it is estimated that the extreme coastal water level could be from 0.2 – 2.8m over the mean level. While in extreme cases like China and the Netherlands it could experience 5-10m of extreme sea levels. Here, the coastal local flood level is added on top of the projected SLR.

Pollution Scenario

Allows choosing the RCP, the greenhouse gas concentration trajectory defined by the IPCC.  The mild level is based on RCP4.5, of 2°C temperature rise; while the Extreme level is based on RCP 8.5, of 4°C temperature rise.

Luck

Applies to the baseline SLR, defined in the “Sea level projection” section, upon which we add flooding. “Mild” refers to the mid-range scenario of 0.5-1.2m, and “extreme” to the pessimistic scenario of 1-2.5m. We used the high-end value of each scenario (mild = 1m; extreme = 2.5m).

Mapping and methodology by Braundt Lau. Article written by Jennie Wong and Owen Mulhern.

You might also like: Sea Level Rise by 2100 – Maldives


References:
  • Kulp, Scott A., and Benjamin H. Strauss. “New elevation data triple estimates of global vulnerability to sea-level rise and coastal flooding.” Nature communications 10.1 (2019): 1-12.
  • Florczyk, A. J., Corbane, C., Ehrlich, D., Freire, S., Kemper, T., Maffenini, L., Melchiorri, M., Politis, P., Schiavina, M., Sabo, F. & Zanchetta, L. (2019). GHSL Data Package 2019 Public Release.
  • Kopp, R. E., DeConto, R. M., Bader, D. A., Hay, C. C., Horton, R. M., Kulp, S., Oppenheimer, M., Pollard, D. & Strauss, B. H. (2017). Evolving Understanding of Antarctic Ice-Sheet Physics and Ambiguity in Probabilistic Sea-Level Projections. Earth’s Future, 5(12), 1217–1233.
  • Kopp, R. E., Horton, R. M., Little, C. M., Mitrovica, J. X., Oppenheimer, M., Rasmussen, D. J., Strauss, B. H. & Tebaldi, C. (2014). Probabilistic 21st and 22nd Century Sea-Level Projections at a Global Network of Tide-Gauge Sites. Earth’s Future, 2(8), 383–406.
  • Kulp, S. A. & Strauss, B. H. (2019). New Elevation Data Triple Estimates of Global Vulnerability to Sea-Level Rise and Coastal Flooding. Nature Communications, 10(1), 4844. Retrieved June 21, 2020, from http://www.nature.com/articles/s41467-019-12808-z
  • Muis, S., Verlaan, M., Winsemius, H. C., Aerts, J. C. J. H. & Ward, P. J. (2016). A Global Reanalysis of Storm Surges and Extreme Sea Levels. Nature Communications, 7.

Research has shown that in the worst-case scenario, 440,000 New Zealanders would be living in regions affected by one-year coastal flood return levels by 2100. Christchurch, standing merely 20 meters above the sea level, faces an imminent threat as the sea level keeps rising.

Earth.Org has mapped what severe flooding would look like in Christchurch by 2100 if no effective measures are taken.

—

New Zealand is located in the collision zone between the Indo-Australian and Pacific plates, which makes it prone to earthquakes. One of these in 2011 aggravated Christchurch’s vulnerability to floods. Pre- and post-earthquake topological data revealed river channels narrowing and shallowing, reducing their water storage and funneling capacity. Along the large regional Waimakariri River north of Christchurch, the flood hazard is particularly evident. There is a 4% chance of water breakout and a severe flooding could cost US $800 million worth of damage. If flooding were to happen, up to 300,000 people would be severely affected.

The Waimakariri Flood Protection Project began in 2010 and was completed in late 2019. The two resulting 25 km embankments along the Waimakariri River aim to provide a back-up flood control for areas around Christchurch. The system is considered a high level of flood protection, aiming to protect people from a 5500 cumecs (cubic meter per second) flood. While this may effectively mitigate floods for the time being, the added effect of sea level rise will increase the risk of the system being overrun.

Earth.Org has mapped what extreme flooding could be like in Christchurch by 2100.

sea level rise by 2100 christchurch

Sea level rise projections by 2100 for two scenarios with the amount of rise in meters indicated (mild = 2m; extreme = 4m). Population displacement indicated bottom right.

Methodology

Global mean sea level is projected to rise by 2m at the end of this century. However, in order to determine local sea level rise (SLR), one has to take into account local coastal flood levels which could be 2.8m above Mean Higher-High Water (MHHW) at extreme forecasts. These local levels bring variability to the projected SLR from 1m to 6.5m (eg. Rio vs Kolkata).

The SLR scenarios used in this study are based on the forecasts from Climate Central – Coastal Risk Screening Tool  with the following parameters:

  • Sea level Projection Source
  • Coastal Flood Level
  • Pollution Scenario
  • Luck

Sea level Projection Source

From two highly cited journals by Kopp et al., estimating SLR mainly due to ocean thermal expansion and ice melt. The mid-range scenario projected 0.5-1.2m of SLR based on different representative concentration pathways (RCP) defined by the IPCC. While the pessimistic scenario added more mechanisms of ice-sheet melting, estimating SLR at 1m-2.5m in 2100, with a projection of 10m SLR at 2300.

Coastal Flooding

More frequent coastal flooding is a direct impact of sea-level rise. Based on the Global tides and surge reanalysis by Muis et al., (2016), it is estimated that the extreme coastal water level could be from 0.2 – 2.8m over the mean level. While in extreme cases like China and the Netherlands it could experience 5-10m of extreme sea levels. Here, the coastal local flood level is added on top of the projected SLR.

Pollution Scenario

Allows choosing the RCP, the greenhouse gas concentration trajectory defined by the IPCC.  The mild level is based on RCP4.5, of 2°C temperature rise; while the Extreme level is based on RCP 8.5, of 4°C temperature rise.

Luck

Applies to the baseline SLR, defined in the “Sea level projection” section, upon which we add flooding. “Mild” refers to the mid-range scenario of 0.5-1.2m, and “extreme” to the pessimistic scenario of 1-2.5m. We used the high-end value of each scenario (mild = 1m; extreme = 2.5m).

Mapping and methodology by Braundt Lau. Article written by Jennie Wong and Owen Mulhern.

You might also like: Sea Level Rise by 2100 – Fiji


References:
  • Kulp, Scott A., and Benjamin H. Strauss. “New elevation data triple estimates of global vulnerability to sea-level rise and coastal flooding.” Nature communications 10.1 (2019): 1-12.
  • Florczyk, A. J., Corbane, C., Ehrlich, D., Freire, S., Kemper, T., Maffenini, L., Melchiorri, M., Politis, P., Schiavina, M., Sabo, F. & Zanchetta, L. (2019). GHSL Data Package 2019 Public Release.
  • Kopp, R. E., DeConto, R. M., Bader, D. A., Hay, C. C., Horton, R. M., Kulp, S., Oppenheimer, M., Pollard, D. & Strauss, B. H. (2017). Evolving Understanding of Antarctic Ice-Sheet Physics and Ambiguity in Probabilistic Sea-Level Projections. Earth’s Future, 5(12), 1217–1233.
  • Kopp, R. E., Horton, R. M., Little, C. M., Mitrovica, J. X., Oppenheimer, M., Rasmussen, D. J., Strauss, B. H. & Tebaldi, C. (2014). Probabilistic 21st and 22nd Century Sea-Level Projections at a Global Network of Tide-Gauge Sites. Earth’s Future, 2(8), 383–406.
  • Kulp, S. A. & Strauss, B. H. (2019). New Elevation Data Triple Estimates of Global Vulnerability to Sea-Level Rise and Coastal Flooding. Nature Communications, 10(1), 4844. Retrieved June 21, 2020, from http://www.nature.com/articles/s41467-019-12808-z
  • Muis, S., Verlaan, M., Winsemius, H. C., Aerts, J. C. J. H. & Ward, P. J. (2016). A Global Reanalysis of Storm Surges and Extreme Sea Levels. Nature Communications, 7.

Brisbane does not frequently experience flooding, but projected sea level rise of 1 to meters by the end of the century would make inundations a common occurrence at high tide. 

Earth.Org takes a closer look.

—

According to the Intergovernmental Panel on Climate Change (IPCC) Fifth Assessment Report, the Queensland Government adopted the forecast that the sea level will rise by 0.8 meters by 2100. This estimate falls under a business as usual scenario, where major emission curbing efforts are not undertaken.

Research conducted by the Labour Environment Action Network reveals that a 0.8-metre rise might flood numerous places in Brisbane. With merely a 0.74-metre sea level rise, the centre of the runway of the Brisbane Airport would only be slightly above the water, while its sides would be flooded by high tides. A 0.74-metre rise would also flood streets and buildings at high tides in Albion, a north-eastern suburb in Brisbane. What is worse is that recent research indicates that the IPCC forecast is likely to be an underestimation than an overestimation. Owing to the acceleration in the ice sheet melt in Greenland and Antarctica, the problem of sea level rise is prone to escalation.

Using the data provided by Climate Central’s latest study, Earth.Org has mapped what extreme flooding would be like in Brisbane by 2100.

sea level rise by 2100 brisbane

Sea level rise projections by 2100 for two scenarios with the amount of rise in meters indicated (mild = 2m; extreme = 4m). Population displacement indicated bottom right.

Methodology

Global mean sea level is projected to rise by 2m at the end of this century. However, in order to determine local sea level rise (SLR), one has to take into account local coastal flood levels which could be 2.8m above Mean Higher-High Water (MHHW) at extreme forecasts. These local levels bring variability to the projected SLR from 1m to 6.5m (eg. Rio vs Kolkata).

The SLR scenarios used in this study are based on the forecasts from Climate Central – Coastal Risk Screening Tool  with the following parameters:

  • Sea level Projection Source
  • Coastal Flood Level
  • Pollution Scenario
  • Luck

Sea level Projection Source

From two highly cited journals by Kopp et al., estimating SLR mainly due to ocean thermal expansion and ice melt. The mid-range scenario projected 0.5-1.2m of SLR based on different representative concentration pathways (RCP) defined by the IPCC. While the pessimistic scenario added more mechanisms of ice-sheet melting, estimating SLR at 1m-2.5m in 2100, with a projection of 10m SLR at 2300.

Coastal Flooding

More frequent coastal flooding is a direct impact of sea-level rise. Based on the Global tides and surge reanalysis by Muis et al., (2016), it is estimated that the extreme coastal water level could be from 0.2 – 2.8m over the mean level. While in extreme cases like China and the Netherlands it could experience 5-10m of extreme sea levels. Here, the coastal local flood level is added on top of the projected SLR.

Pollution Scenario

Allows choosing the RCP, the greenhouse gas concentration trajectory defined by the IPCC.  The mild level is based on RCP4.5, of 2°C temperature rise; while the Extreme level is based on RCP 8.5, of 4°C temperature rise.

Luck

Applies to the baseline SLR, defined in the “Sea level projection” section, upon which we add flooding. “Mild” refers to the mid-range scenario of 0.5-1.2m, and “extreme” to the pessimistic scenario of 1-2.5m. We used the high-end value of each scenario (mild = 1m; extreme = 2.5m).

Mapping and methodology by Braundt Lau. Article written by Jennie Wong and Owen Mulhern.

You might also like: Sea Level Rise by 2100 – Fiji


References:
  • Kulp, Scott A., and Benjamin H. Strauss. “New elevation data triple estimates of global vulnerability to sea-level rise and coastal flooding.” Nature communications 10.1 (2019): 1-12.
  • Florczyk, A. J., Corbane, C., Ehrlich, D., Freire, S., Kemper, T., Maffenini, L., Melchiorri, M., Politis, P., Schiavina, M., Sabo, F. & Zanchetta, L. (2019). GHSL Data Package 2019 Public Release.
  • Kopp, R. E., DeConto, R. M., Bader, D. A., Hay, C. C., Horton, R. M., Kulp, S., Oppenheimer, M., Pollard, D. & Strauss, B. H. (2017). Evolving Understanding of Antarctic Ice-Sheet Physics and Ambiguity in Probabilistic Sea-Level Projections. Earth’s Future, 5(12), 1217–1233.
  • Kopp, R. E., Horton, R. M., Little, C. M., Mitrovica, J. X., Oppenheimer, M., Rasmussen, D. J., Strauss, B. H. & Tebaldi, C. (2014). Probabilistic 21st and 22nd Century Sea-Level Projections at a Global Network of Tide-Gauge Sites. Earth’s Future, 2(8), 383–406.
  • Kulp, S. A. & Strauss, B. H. (2019). New Elevation Data Triple Estimates of Global Vulnerability to Sea-Level Rise and Coastal Flooding. Nature Communications, 10(1), 4844. Retrieved June 21, 2020, from http://www.nature.com/articles/s41467-019-12808-z
  • Muis, S., Verlaan, M., Winsemius, H. C., Aerts, J. C. J. H. & Ward, P. J. (2016). A Global Reanalysis of Storm Surges and Extreme Sea Levels. Nature Communications, 7.

Despite sophisticated flood control infrastructure, large parts of the Zhuhai-Macau area are projected to be below sea level by 2100. Sea level rise of 65 centimeters, together with high tide, would flood 3400 km2 of the Zhuhai region.

Earth.Org has mapped what a severe flood would look like these two cities by 2100.

—

Situated at the southern tip of China, Zhuhai, and Macau generally have a humid subtropical climate with abundant rainfall. Recent rainfall extremes reached 482.8 millimeters over a single night in the port city of Zhuhai, causing flash floods and showcasing the region’s vulnerability to such events.

Extreme coastal flooding and intensified storm surges are the two main drivers of inundation, and sea level rise exacerbates both. Macau, built on a low-lying area, has become more vulnerable to coastal flooding in recent years. The 2018 Typhoon Mangkhut has led to severe flooding in the casino hub, forcing 1280 citizens to stay in temporary shelters. With newer estimates predicting a 1 to 2-meter increase in sea levels, Macau and Zhuhai officials urgently need to start planning an adaptation strategy.

As it is, their drainage systems are pushed to the limit. Zhuhai has a sewage outlet elevation of 1.24 meter, which is 10 centimeters lower than its local highest tide level. Over the total number of rainfall events in a year, Zhuhai needs sewage or flooding water drainage 11% of the time. Stagnant floodwaters have become a common problem, promoting mosquito proliferation.

As a call to action, Earth.Org has mapped what extreme flooding could look like in Zhuhai and Macau by 2100.

sea level rise by 2100 zhuhai & macau

Sea level rise projections by 2100 for two scenarios with the amount of rise in meters indicated (mild = 2m; extreme = 4m). Population displacement indicated bottom right.

Sea Level Rise Methodology

Global mean sea level is projected to rise by 2m at the end of this century. However, in order to determine local sea level rise (SLR), one has to take into account local coastal flood levels which could be 2.8m above Mean Higher-High Water (MHHW) at extreme forecasts. These local levels bring variability to the projected SLR from 1m to 6.5m (eg. Rio vs Kolkata).

The SLR scenarios used in this study are based on the forecasts from Climate Central – Coastal Risk Screening Tool  with the following parameters:

  • Sea level Projection Source
  • Coastal Flood Level
  • Pollution Scenario
  • Luck

Sea level Projection Source

From two highly cited journals by Kopp et al., estimating SLR mainly due to ocean thermal expansion and ice melt. The mid-range scenario projected 0.5-1.2m of SLR based on different representative concentration pathways (RCP) defined by the IPCC. While the pessimistic scenario added more mechanisms of ice-sheet melting, estimating SLR at 1m-2.5m in 2100, with a projection of 10m SLR at 2300.

Coastal Flooding

More frequent coastal flooding is a direct impact of sea-level rise. Based on the Global tides and surge reanalysis by Muis et al., (2016), it is estimated that the extreme coastal water level could be from 0.2 – 2.8m over the mean level. While in extreme cases like China and the Netherlands it could experience 5-10m of extreme sea levels. Here, the coastal local flood level is added on top of the projected SLR.

Pollution Scenario

Allows choosing the RCP, the greenhouse gas concentration trajectory defined by the IPCC.  The mild level is based on RCP4.5, of 2°C temperature rise; while the Extreme level is based on RCP 8.5, of 4°C temperature rise.

Luck

Applies to the baseline SLR, defined in the “Sea level projection” section, upon which we add flooding. “Mild” refers to the mid-range scenario of 0.5-1.2m, and “extreme” to the pessimistic scenario of 1-2.5m. We used the high-end value of each scenario (mild = 1m; extreme = 2.5m).

Mapping and methodology by Braundt Lau. Article written by Jennie Wong and Owen Mulhern.

You might also like: Sea Level Rise by 2100 – Fiji


References:
  • Kulp, Scott A., and Benjamin H. Strauss. “New elevation data triple estimates of global vulnerability to sea-level rise and coastal flooding.” Nature communications 10.1 (2019): 1-12.
  • Florczyk, A. J., Corbane, C., Ehrlich, D., Freire, S., Kemper, T., Maffenini, L., Melchiorri, M., Politis, P., Schiavina, M., Sabo, F. & Zanchetta, L. (2019). GHSL Data Package 2019 Public Release.
  • Kopp, R. E., DeConto, R. M., Bader, D. A., Hay, C. C., Horton, R. M., Kulp, S., Oppenheimer, M., Pollard, D. & Strauss, B. H. (2017). Evolving Understanding of Antarctic Ice-Sheet Physics and Ambiguity in Probabilistic Sea-Level Projections. Earth’s Future, 5(12), 1217–1233.
  • Kopp, R. E., Horton, R. M., Little, C. M., Mitrovica, J. X., Oppenheimer, M., Rasmussen, D. J., Strauss, B. H. & Tebaldi, C. (2014). Probabilistic 21st and 22nd Century Sea-Level Projections at a Global Network of Tide-Gauge Sites. Earth’s Future, 2(8), 383–406.
  • Kulp, S. A. & Strauss, B. H. (2019). New Elevation Data Triple Estimates of Global Vulnerability to Sea-Level Rise and Coastal Flooding. Nature Communications, 10(1), 4844. Retrieved June 21, 2020, from http://www.nature.com/articles/s41467-019-12808-z
  • Muis, S., Verlaan, M., Winsemius, H. C., Aerts, J. C. J. H. & Ward, P. J. (2016). A Global Reanalysis of Storm Surges and Extreme Sea Levels. Nature Communications, 7.

The Maldives, an island nation south of India, is extremely vulnerable to sea level rise. With 80% of the nation only around 1 metre above sea level, it is predicted that approximately 77% of its land area will be underwater by 2100. Measures have been taken by authorities to mitigate potential damages brought by sea level rise and extreme weather. 

Earth.Org has mapped what extreme flooding could look like by 2100 to illustrate the need for action.

—

Known as the “ Treasure Island”, Maldives is made up of 26 ringed shaped atolls and with a population of 450,000. The nation is also the flattest country on Earth making it extra sensitive to small changes in sea level. 

Headlines warning of the island states imminent submersion seems to have numbed the general public. Since the 1950s sea level in and around the Maldives has been rising fast on a geophysical scale, but a rate of 0.8 to 1.6 millimetre per year can seem slow to humans. 2100 seems far away, but in a person’s lifetime, the Maldives could experience a 50-centimetre sea level rise and lose around 80% of its land. If sea level were to rise by 1 metre, which seems like according to a recent Climate Central article, the islands would lose 85% of their surface to the ocean.

Much of its housing and critical infrastructures, such as hospitals, airports and harbours, are concentrated on the coastline. Extreme levels of sea rise will not be necessary to force costly adaptation or relocation. It may not be economically feasible to save the island, but maybe the possibility of losing this idyllic island to the oceans will stir some into action. 

Earth.Org has modelled what mild and extreme flooding events could look like in the Maldives’ most populous island, Malé by 2100 under a high emissions scenario as a call for awareness. 

sea level rise by 2100 maldives

Sea level rise projections by 2100 for two scenarios with the amount of rise in meters indicated (mild = 1m; extreme = 3m). Population displacement indicated bottom right.

Methodology

Global mean sea level is projected to rise by 2m at the end of this century. However, in order to determine local sea level rise (SLR), one has to take into account local coastal flood levels which could be 2.8m above Mean Higher-High Water (MHHW) at extreme forecasts. These local levels bring variability to the projected SLR from 1m to 6.5m (eg. Rio vs Kolkata).

The SLR scenarios used in this study are based on the forecasts from Climate Central – Coastal Risk Screening Tool  with the following parameters:

  • Sea level Projection Source
  • Coastal Flood Level
  • Pollution Scenario
  • Luck

Sea level Projection Source

From two highly cited journals by Kopp et al., estimating SLR mainly due to ocean thermal expansion and ice melt. The mid-range scenario projected 0.5-1.2m of SLR based on different representative concentration pathways (RCP) defined by the IPCC. While the pessimistic scenario added more mechanisms of ice-sheet melting, estimating SLR at 1m-2.5m in 2100, with a projection of 10m SLR at 2300.

Coastal Flooding

More frequent coastal flooding is a direct impact of sea-level rise. Based on the Global tides and surge reanalysis by Muis et al., (2016), it is estimated that the extreme coastal water level could be from 0.2 – 2.8m over the mean level. While in extreme cases like China and the Netherlands it could experience 5-10m of extreme sea levels. Here, the coastal local flood level is added on top of the projected SLR.

Pollution Scenario

Allows choosing the RCP, the greenhouse gas concentration trajectory defined by the IPCC.  The mild level is based on RCP4.5, of 2°C temperature rise; while the Extreme level is based on RCP 8.5, of 4°C temperature rise.

Luck

Applies to the baseline SLR, defined in the “Sea level projection” section, upon which we add flooding. “Mild” refers to the mid-range scenario of 0.5-1.2m, and “extreme” to the pessimistic scenario of 1-2.5m. We used the high-end value of each scenario (mild = 1m; extreme = 2.5m).

Mapping and methodology by Braundt Lau.

You might also like: Sea Level Rise by 2100 – Antwerp

References:
  • Kulp, Scott A., and Benjamin H. Strauss. “New elevation data triple estimates of global vulnerability to sea-level rise and coastal flooding.” Nature communications 10.1 (2019): 1-12.
  • Florczyk, A. J., Corbane, C., Ehrlich, D., Freire, S., Kemper, T., Maffenini, L., Melchiorri, M., Politis, P., Schiavina, M., Sabo, F. & Zanchetta, L. (2019). GHSL Data Package 2019 Public Release.
  • Kopp, R. E., DeConto, R. M., Bader, D. A., Hay, C. C., Horton, R. M., Kulp, S., Oppenheimer, M., Pollard, D. & Strauss, B. H. (2017). Evolving Understanding of Antarctic Ice-Sheet Physics and Ambiguity in Probabilistic Sea-Level Projections. Earth’s Future, 5(12), 1217–1233.
  • Kopp, R. E., Horton, R. M., Little, C. M., Mitrovica, J. X., Oppenheimer, M., Rasmussen, D. J., Strauss, B. H. & Tebaldi, C. (2014). Probabilistic 21st and 22nd Century Sea-Level Projections at a Global Network of Tide-Gauge Sites. Earth’s Future, 2(8), 383–406.
  • Kulp, S. A. & Strauss, B. H. (2019). New Elevation Data Triple Estimates of Global Vulnerability to Sea-Level Rise and Coastal Flooding. Nature Communications, 10(1), 4844. Retrieved June 21, 2020, from http://www.nature.com/articles/s41467-019-12808-z
  • Muis, S., Verlaan, M., Winsemius, H. C., Aerts, J. C. J. H. & Ward, P. J. (2016). A Global Reanalysis of Storm Surges and Extreme Sea Levels. Nature Communications, 7.

Lagos is located on the coast and comprises numerous islands. Owing to the poor drainage system and excessive groundwater extraction, the incoming challenges of sea level rise have been magnified.

Earth.Org has mapped what extreme flooding would look like in Lagos by the end of the century.

—

As one of the coastal megacities in Africa, Lagos serves as an important port for commercial activities. Built around the Lagos Lagoon, it opens on the Atlantic Ocean and comprises of a piece of the mainland and an ensemble of low-lying islands.  The geography of the city makes it susceptible to coastal flooding and saltwater intrusion, especially considering that most of its upscale neighborhoods and business centers are built on the islands. 

Moreover, its poorly designed and maintained drainage system contributes as an aggravating factor to the frequent inundations. Officials do not seem interested in flood control, be it the constructions of dikes, embankment, or seawalls. This is despite studies showing that a sea level rise of 1 to 3 meters would have “a catastrophic effect on human activities” in regions including Lagos.

In 2007, the Nigerian authorities initiated a reclamation project – the construction of a new island,  Eko Atlantic, supposed to reverse coastal erosion and curb land depletion. It borders Lagos directly, covering 10 km², housing up to 250,000 residents, and features many high-end commerces and residences. It has been a target of heavy criticism from locals who denounced the lower-income families that were forced out and claim it is eroding the coastline of the surrounding area, actually increasing flood likelihood. 

Regardless of the controversy, this public-private partnership-project is insufficient to protect Lagos against the expected amplitude of sea level rise by the end of the century. 

Earth.Org has mapped what extreme flooding could be like in Lagos by then as a call for action.

sea level rise by 2100 lagos

Sea level rise projections by 2100 for two scenarios with the amount of rise in meters indicated (mild = 2m; extreme = 4m). Population displacement indicated bottom right.

Methodology

Global mean sea level is projected to rise by 2m at the end of this century. However, in order to determine local sea level rise (SLR), one has to take into account local coastal flood levels which could be 2.8m above Mean Higher-High Water (MHHW) at extreme forecasts. These local levels bring variability to the projected SLR from 1m to 6.5m (eg. Rio vs Kolkata).

The SLR scenarios used in this study are based on the forecasts from Climate Central – Coastal Risk Screening Tool  with the following parameters:

  • Sea level Projection Source
  • Coastal Flood Level
  • Pollution Scenario
  • Luck

Sea level Projection Source

From two highly cited journals by Kopp et al., estimating SLR mainly due to ocean thermal expansion and ice melt. The mid-range scenario projected 0.5-1.2m of SLR based on different representative concentration pathways (RCP) defined by the IPCC. While the pessimistic scenario added more mechanisms of ice-sheet melting, estimating SLR at 1m-2.5m in 2100, with a projection of 10m SLR at 2300.

Coastal Flooding

More frequent coastal flooding is a direct impact of sea-level rise. Based on the Global tides and surge reanalysis by Muis et al., (2016), it is estimated that the extreme coastal water level could be from 0.2 – 2.8m over the mean level. While in extreme cases like China and the Netherlands it could experience 5-10m of extreme sea levels. Here, the coastal local flood level is added on top of the projected SLR.

Pollution Scenario

Allows choosing the RCP, the greenhouse gas concentration trajectory defined by the IPCC.  The mild level is based on RCP4.5, of 2°C temperature rise; while the Extreme level is based on RCP 8.5, of 4°C temperature rise.

Luck

Applies to the baseline SLR, defined in the “Sea level projection” section, upon which we add flooding. “Mild” refers to the mid-range scenario of 0.5-1.2m, and “extreme” to the pessimistic scenario of 1-2.5m. We used the high-end value of each scenario (mild = 1m; extreme = 2.5m).

Mapping and methodology by Braundt Lau. Article written by Jennie Wong and Owen Mulhern.

You might also like: Sea Level Rise by 2100 – Antwerp


References:
  • Kulp, Scott A., and Benjamin H. Strauss. “New elevation data triple estimates of global vulnerability to sea-level rise and coastal flooding.” Nature communications 10.1 (2019): 1-12.
  • Florczyk, A. J., Corbane, C., Ehrlich, D., Freire, S., Kemper, T., Maffenini, L., Melchiorri, M., Politis, P., Schiavina, M., Sabo, F. & Zanchetta, L. (2019). GHSL Data Package 2019 Public Release.
  • Kopp, R. E., DeConto, R. M., Bader, D. A., Hay, C. C., Horton, R. M., Kulp, S., Oppenheimer, M., Pollard, D. & Strauss, B. H. (2017). Evolving Understanding of Antarctic Ice-Sheet Physics and Ambiguity in Probabilistic Sea-Level Projections. Earth’s Future, 5(12), 1217–1233.
  • Kopp, R. E., Horton, R. M., Little, C. M., Mitrovica, J. X., Oppenheimer, M., Rasmussen, D. J., Strauss, B. H. & Tebaldi, C. (2014). Probabilistic 21st and 22nd Century Sea-Level Projections at a Global Network of Tide-Gauge Sites. Earth’s Future, 2(8), 383–406.
  • Kulp, S. A. & Strauss, B. H. (2019). New Elevation Data Triple Estimates of Global Vulnerability to Sea-Level Rise and Coastal Flooding. Nature Communications, 10(1), 4844. Retrieved June 21, 2020, from http://www.nature.com/articles/s41467-019-12808-z
  • Muis, S., Verlaan, M., Winsemius, H. C., Aerts, J. C. J. H. & Ward, P. J. (2016). A Global Reanalysis of Storm Surges and Extreme Sea Levels. Nature Communications, 7.

Subscribe to our newsletters

The best environmental stories of the week and month, handpicked by our Editor. Make sure you're on top of what's new in the climate.

SUBSCRIBE