As the second most abundant greenhouse gas in our atmosphere (after water vapor), carbon dioxide (CO2) has become a direct proxy for measuring climate change. Its levels have varied widely over the course of the Earth’s 4.54 billion year history, partly driving swings in our planet’s average temperature.
—
The History of CO2
Scientific consensus today describes our atmosphere’s evolution in three stages.
Around the time of Earth’s formation, our solar system was dense with helium and hydrogen which bounced around the Earth’s surface at extremely high temperatures. These molecules eventually escaped into space and were replaced by our second atmosphere: volcanic emissions. Eruptions dispersed water steam, CO2, and ammonia (one nitrogen and three hydrogens), forming a gassy blanket above and early water bodies below. CO2 slowly dissolved into the shallow ocean and allowed cyanobacteria to perform oxygen-emitting photosynthesis. This oxygen eventually accumulated until the atmospheric composition changed enough to kill off most micro-organisms present at the time, about 2.4 billion years ago.
CO2 and Past Climates
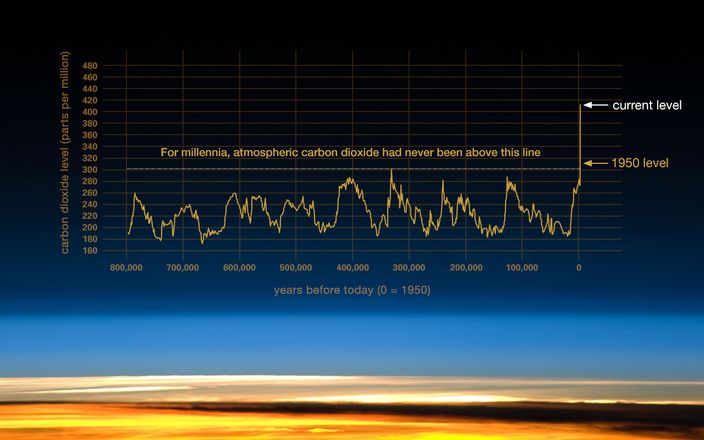
As a point of reference, pre-industrial CO2 levels were around 280 parts per million (ppm). Today, we stand near 426.24 ppm.
Historic atmospheric concentrations of carbon dioxide (CO2). Image: WMO (2024).
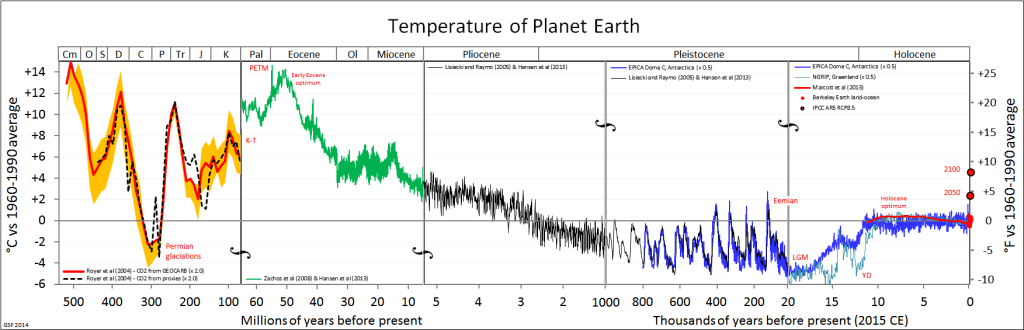
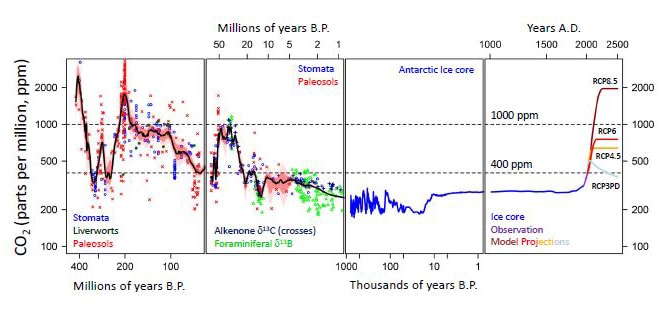
The most distant period in time for which we have estimated CO2 levels is around the Ordovician period, 500 million years ago. At the time, atmospheric CO2 concentration ranged between 3,000 to 9,000 ppm. The average temperature wasn’t much more than 10C above today’s temperature, and those of you who have heard of the runaway hothouse Earth scenario may wonder why it didn’t happen then. Major factors were that the Sun was cooler, and the planet’s orbital cycles were different.
CO2 levels over the past 500 million years. Graph: Foster et al.
CO2 levels are determined by the imbalance between carbon sequestration (burial in sediments, capture by plants), and carbon emissions (decomposition and volcanic activity). Imbalances in this system created a downward trend in CO2 levels, leading to a glaciation period around 300 million years ago. This was followed by a period of intense volcanic activity, doubling CO2 concentration to about 1,000 ppm. Levels then dropped until they reached today’s concentrations during the Oligocene era, 33 to 23 million years ago, when temperatures were still 4-6C higher than today.
Temperature estimates over the past 500 million years. Graph: Glen Fergus via Wikimedia Commons.
This is quite a worrying fact as the amounts of greenhouse gases we have emitted could already potentially take us back to similar conditions.
CO2 Data from Ice Cores
It is undeniable that the climate is an extremely complicated system with many factors that we still do not quite understand, so such statements need to be taken with a grain of salt. Moreover, the further we look back, the more uncertainty there is around the data. Robust evidence “only” spans back 800,000 years thanks to ice cores providing high-resolution records in the form of air bubbles trapped under the freezing snow.
Robust CO2 data from ice cores covering the last 800,000 years. Graph: NASA.
The Highest Levels of Co2 in Recent History
We use this record as a baseline to compare current events to, and the post-industrial upward trend in CO2 concentrations is evident. Unfortunately, the trend is recent enough that the results have yet to fully kick in. The time lag between CO2 emission and their pollution and warming effect is around 50 years, and whatever changes we observe now are only the tip of the iceberg.
Looking back at the 2 extra degrees of warmth last time CO2 levels were this high (Pliocene era, 3 million years ago), should be enough of a call to action considering the damage two more degrees would cause today.
This article was originally published on August 12, 2020 and updated on August 28, 2025.
References
Inglis, Gordon N., et al. “Descent toward the Icehouse: Eocene sea surface cooling inferred from GDGT distributions.” Paleoceanography 30.7 (2015): 1000-1020
By Glen Fergus – Own work; data sources are cited below, CC BY-SA 3.0, https://commons.wikimedia.org/w/index.php?curid=1240577
This story is funded by readers like you
Our non-profit newsroom provides climate coverage free of charge and advertising. Your one-off or monthly donations play a crucial role in supporting our operations, expanding our reach, and maintaining our editorial independence.
When we picture the tools we deploy to fight climate change, we often think of renewable energy and electric vehicles. Rarely do we think about simulations.
—
Computational Fluid Dynamics (CFD) is a branch of science that uses the physics of fluids (like water, air, fuel, flames etc.), mathematics and computer science to create accurate real-life simulations.
CFD aids researchers in simulating everything from droplets to complex ocean currents and atmospheric turbulence. It is a powerful tool that plays a vital role in understanding and predicting the behavior of complex natural systems and extreme weather events.
Map of Ocean currents with sea surface temperature data. Image: NASA/Goddard Space Flight Center Scientific Visualization Studio.
The Earth’s climate represents a massive complex fluid dynamics problem. For example, as shown in Figure 1, air flow over Canary Island generates a swirling vortex called the von Kármán vortex street, a phenomenon also seen in classic fluid dynamics scenarios such as flow past a cylinder.
Every climate event, from air and ocean currents to rainfall, hurricanes, tornadoes, and heatwaves, involves the movement of fluid (air, water, droplets, humidity). By using the equations governed by fluid flow, CFD can simulate these natural phenomena accurately with the help of high performance computers and mathematics. For instance, the MIT General Circulation Model (Figure 2) is used to study ocean currents and heat transport, helping us understand long-term ocean trends.
Other models and simulations from these models help researchers understand how heat and moisture are transported in the atmosphere, predict how oceans circulate heat across the planet, simulate the formation and path of hurricanes or cyclones as well as model the impact of melting ice sheets and rising sea levels.
Clean Energy Modelling
Implementing renewable energy infrastructure like wind farms, tidal power stations, or other clean sources like nuclear requires costly and energy-intensive physical testing. This, in turn, can generate carbon emissions and material waste, partly offsetting the environmental benefits associated with these technologies.
Simulations offer a sustainable alternative and help engineers design, optimize, and implement clean energy technologies with far less environmental impact. For instance, as shown in Figure 3, CFD simulations can be used to optimize turbine blade shapes or determine the most efficient layout of turbines across wind farms to reduce wake loss and maximize energy output. Similar approaches are used to model cooling systems in solar farms or simulate flow dynamics in tidal and nuclear energy systems.
These digital experiments are not only faster and more cost-effective but also significantly reduce carbon footprint and material waste.
Earth’s water resources have constantly been polluted by industrial waste, sewage discharge, littering, and agricultural runoff. Accidental or not, oil spills pose a great threat to the environment and marine eco-systems, as seen in disasters like the 2010 Deepwater Horizon spill – the largest marine oil spill in history.
CFD is used to study how oil spreads in the ocean. These simulations help predict how oil moves through water, how it breaks apart, and how it interacts with wind, waves, and currents.
Schematics of subsea oil spill. Image: Barker et al./MPDI (2020).
For example, the ADIOS model developed by the National Oceanic and Atmospheric Administration (NOAA) uses such simulations to estimate how oil might behave under different conditions. Various other computational tools have also been used to simulate how oil rises from deep-sea blowouts and travels through the ocean. These tools help emergency teams respond faster by showing where the oil will go and how to contain it without needing to run expensive or polluting physical tests.
This technology allows us not only to better prepare for oil spill emergencies but also to improve laws and safety regulations.
What the Future Holds
The examples discussed above are just the tip of the iceberg. There are many more ways computer simulations, including CFD, are helping us tackle climate change. Of course, building these high-fidelity simulations comes with its own challenges.
Running simulations requires computing power, which consumes energy and contributes to carbon emissions. However, the environmental cost of simulations is only a small fraction compared to that of full-scale physical experiments
The world of computational science is evolving rapidly. New algorithms and numerical techniques are constantly improving simulation efficiency, reducing both time and energy requirements. Moreover, more data centers are transitioning to renewable energy and are being cooled effectively. From liquid cooling systems to hybrid designs, these advancements significantly lower the carbon footprint of large-scale simulations.
As the climate crisis deepens, the need to act swiftly and smartly grows. CFD doesn’t just help us predict the future, it allows us to design better solutions, reduce waste, and avoid environmental damage before it begins. It lets us simulate the world we want to build and the ones we hope to avoid.
Featured image: Allison Nussbaum/NASA Earth Observatory.
This story is funded by readers like you
Our non-profit newsroom provides climate coverage free of charge and advertising. Your one-off or monthly donations play a crucial role in supporting our operations, expanding our reach, and maintaining our editorial independence.
Air pollution is a global crisis that has severe implications for the environment and human health. This article provides a comprehensive analysis of the most polluted cities around the world. We look at the main sources of pollution, analyse the efficiency of the measures that are being taken by governments to tackle the issue, and provide insights into the future of air quality.
—
“Clean air is a human right. Unfortunately, it is not a reality for a large proportion of the world’s population.” – Dr. Maria Neira, Director of the Public Health, Environment and Social Determinants of Health Department of the World Health Organization.
Why Should We Care About Air Pollution?
Air pollution is the greatest environmental threat to public health globally. Improving our air quality will bring health, development, and environmental benefits. With every breath we take, we suck in tiny particles that can damage our lungs, hearts, and brains and cause a host of other health problems. The most dangerous of these particles, which can include anything from soot, soil dust, to sulphates, are fine particles 2.5 microns or less in diameter – shortened as PM2.5.
According to Dr Maria Neira, Director of Environment, Climate Change and Health at the World Health Organization (WHO), about 9 out of 10 people are exposed to air pollution at levels above the WHO air quality guidelines. Researchers found that daily air pollution levels globally exceed 15 μg/m3 – the safe threshold value recommended by the WHO – for more than 70% of days in 2019. As a result, about 7 million people die every year due to ambient or household air pollution. This number is only the tip of the iceberg, as there is also a huge burden of sickness, hospitalisation, reduced life expectancy, and the associated social and economic impacts of lost productivity and healthcare costs.
Mapping the Cities With the Most Dangerous Levels of Pollution
Mapping the most polluted cities and countries in the world helps identifying the primary sources of pollution and their causes, as well as understanding the consequences of high levels of pollution on human health and the environment.
The following are the 10 most polluted cities in the world:
1. Lahore, Pakistan
2. Hotan, China
3. Bhiwadi, India
4. Delhi (NCT), India
5. Peshawar, Pakistan
6. Darbhanga, India
7. Asopur, India
8. N’Djamena, Chad
9. New Delhi, India
10. Patna, India
While Indian cities top the world’s most polluted cities’ list, India does not place among the five most polluted countries globally. The latter are topped by nations much smaller in geographical area, which brings up the annual average PM2.5 concentration (μg/m³).
The following are the 5 most polluted countries in the world, according to IQAir:
1. Chad
2. Iraq
3. Pakistan
4. Bahrain
5. Bangladesh
What Is Air Pollution?
Ambient air pollution is caused by a number of air pollutants, including NOx, ozone, carbon monoxide, and sulphur dioxides. PM2.5 is the air pollutant that has been most closely studied and is most commonly used as a proxy indicator of exposure to air pollution more generally. Particulate matter consists of a complex mixture of solid and liquid particles of organic and inorganic substances suspended in the air.
The major components of PM are sulphates, nitrates, ammonia, sodium chloride, black carbon, mineral dust, and water. The most health-damaging particles are those with a diameter of 10 μm or less, which can penetrate and lodge deep inside the lungs. Both short- and long-term exposure to air pollutants have been associated with health impacts such as lung cancer, heart disease and stroke, according to the World Health Organization.
The primary sources of pollution in each of the most polluted cities are residential pollution, mostly from cooking and heating using biomass, generating electricity from fossil fuels for our homes, and transport. Windblown dust is also a major source in portions of Africa and West Asia that are close to deserts. Windblown dust, emitted from the surface of the earth to the atmosphere, has significant impacts on atmospheric phenomena, air quality, and human health.
Respiratory and cardiovascular disorders, meningococcal meningitis, conjunctivitis, and skin irritations are among the health problems that have been associated with exposure to dust. Specifically, airborne dust particles (in particular those finer than 10 microns in diameter, called PM10) can penetrate deep into the lungs and impair respiratory processes. Dust that contains heavy metals or other toxic compounds can also cause a wide range of acute and chronic health effects.
Explore the map below to understand the impact of air pollution on human life in each country.
The most common health problems associated with air pollution include stroke, heart disease, lung disease, lower respiratory diseases, and cancer. Explore the map below to find out what percent of death in any given country can be attributed to outdoor fine particles.
Despite the grave health risks associated with air pollution, many countries still face challenges in meeting their clean air targets. However, some countries are making progress, such as the Philippines, Indonesia, and Brazil, among others. The global community needs to take action to reduce air pollution by making lifestyle changes, reducing energy consumption, and adopting environmentally conscious alternatives to wood-burning stoves, among others.
How Does Air Pollution Affect the Environment?
Air pollution has significant negative impacts on the environment. Acid rain, caused by air pollutants such as sulphur dioxide and nitrogen dioxide, is harmful to natural ecosystems, interfering with the root’s cell division and ability to elongate, reducing essential nutrients for plants, and threatening wildlife, particularly aquatic animals. Eutrophication, the enrichment of a waterbody with minerals and nutrients that lead to excessive algae growth, blocks sunlight from underwater plants and consumes large amounts of oxygen in the water, resulting in the death of aquatic plants and animals. Human activities, such as energy production and fertiliser use, contribute significantly to eutrophication.
While air pollutants are distinguished from greenhouse gases, some air pollutants, such as ground-level ozone, possess warming power and can trap heat in the atmosphere. However, some air pollutants, like aerosol, have a positive effect on resisting climate change, as they possess cooling power by changing the amount of solar energy entering and leaving the atmosphere and forming clouds. Scientists are exploring the possibility of manipulating aerosols to slow down climate change, but controlling the number of airborne particles within a safe range remains a challenge.
There are many ways individuals can reduce their personal air pollution footprint, including using public transportation, reducing energy consumption, moderating waste, and using air filtration and purification systems to improve indoor air quality. Additionally, people can limit outdoor activities when air quality is at unhealthy levels and stay informed about real-time air quality conditions using apps.
However, the problem of air pollution requires the collective efforts of individuals, communities, and governments worldwide. Governments can invest in energy-efficient power generation, improve waste management, and promote greener and more compact cities with energy-efficient buildings. Additionally, providing universal access to clean, affordable fuels and technologies and building safe and affordable public transport systems can help reduce air pollution.
As we continue to map the most polluted cities in the world, let’s also work towards a future where clean air is a fundamental human right, and every individual has the opportunity to live a healthy and fulfilling life.
This story is funded by readers like you
Our non-profit newsroom provides climate coverage free of charge and advertising. Your one-off or monthly donations play a crucial role in supporting our operations, expanding our reach, and maintaining our editorial independence.
As the human population grows, so does food demand. While famine has been greatly reduced, adequate food supply for all has not been achieved and we are expecting another 1 to 3 billion mouths to feed in the next few decades. Classical agriculture is driving deforestation, and its yields are suffering from reduced soil quality and climate change variability. Could an Aquaponics system be the solution to food insecurity?
Aquaponics is a type of farming system that combines aquaculture (farming of fish in water environment) with hydroponics (growing plants with water instead of soil) in a closed-loop system. The animals provide nutrients in the form of broken down excretions, which allow the plants to grow.
The obvious advantages are the reduced land and fertiliser usage, and weather dependence. The amount of water required is also 90-99% less than that of agriculture. Successful examples are beginning to appear, like the GrowUp Urban Farm in London, committed to help feed and educate its community through aquaponic cultures built in a shipping container. At the University of New Hampshire, students help monitor the aquaponics system built on campus, providing food directly to the campus’ dining service.
Finally, the Canadian company The Growcer helps communities, retailers, and organisations grow produce in the Northern parts of Canada where food accessibility is limited by introducing hydroponic container farms. These containers have up to 3,600 planting slots and can allow up to 140 varieties of produce to grow in the container at once.
Could Aquaponics Systems Help Solve Food Insecurity?
At first glance, the aquaponics system seems like the perfect solution to agriculture’s ails. It can help communities, where agriculture is insufficient to feed the population, become less reliant on imports. The systems can also be located wherever is most convenient, reducing supply chain length and thus food loss during transportation. However, as you may have guessed, there are a few important flaws.
First, the system requires a large amount of energy to run, which may be a problem for many developing countries where resources are scarce. Solutions like direct solar energy supply are feasible, but even more expensive. Other restrictive features include the need for precise water acidity balance, temperature regulation, algae growth and chemical compound build-up control. The expertise and time required may not be available to places most in need of agriculture solutions.
The aquaponics system is undeniably more economical and resource-efficient when compared to traditional farming methods. The amount of water it saves could be the most significant aspect considering that 70% of all freshwater used by humans goes into agriculture, and looming water crisis.
The technology needs to be optimised to reduce energy, expertise and supervision requirements before it can become a viable source for the global food supply.
This article was written by June Leung and Owen Mulhern.
Permafrost is a permanently frozen layer below the Earth’s surface, consisting of soil, gravel, and sand, usually bound together by ice. Accelerating permafrost thaw is an issue of great concern to the scientific community and, increasingly, the general public. Rising temperatures are disrupting the balanced state of an ecosystem leading to the emission of methane (CH4), a potent greenhouse gas. Without urgent action to curtail the warming of our planet, half of the world’s permafrost could disappear by the year 2100.
—
What Is Permafrost?
The word ‘permafrost’ was coined by Siemon William Muller, an American geologist as a constriction of ‘permanent frost’. It is defined as a ground that remains frozen for at least two consecutive years and is essentially a mixture of rock, soil, sediment, ice, and organic material. Occurring at high altitudes and latitudes, permafrost covers about 24 % of the Northern Hemisphere. The large majority is found in Russia and Canada near and above the arctic circle.
Permafrost is isolated from the atmosphere by a boundary called an “active layer”, consisting of live plants in summer, with added snow in winter. The active layer transfers heat from or to the permafrost. Permafrost holds the largest global carbon reserve, estimated to contain 1,400 billion tons of carbon, nearly double the amount present in the atmosphere.
There are four ways to describe the distribution of permafrost: continuous, discontinuous, isolated, and sporadic permafrost. Continuous permafrost represents an area where frozen soil underlies larger than 90 % of the surface. It is usually found in the coldest areas like part of Siberia. Discontinuous permafrost is usually found in an area where frozen soils lie beneath 50 to 90 % of the surface. Southern Hudson Bay, Canada, has discontinuous permafrost. Sporadic permafrost occurs when frozen soils lie behind 10 to 50 % of the surface. In isolated permafrost, the frozen soils underlie below 10 % of the surface.
Fig. 2. Permafrost Distribution. Source: Brown et al. (1997)
Methane and Permafrost
Methane is a natural gas that contains a carbon atom bonded to four hydrogen atoms. Even though methane constitutes only 0.00018 percent of the atmosphere, it is responsible for about one-sixth of the last few decades’ global warming. Estimates for arctic methane emissions have gone from 0.5 million tons to 3.8 million tons a year in 2006, then up to 17 million tons in 2013. We don’t have solid measurements yet, but we know the phenomenon is gaining momentum as we speak. A study conducted by Knoblauch et al. 2018 reveals that permafrost soils from the Northern pole would generate one gigaton, or 1000 million tons of methane by 2100.
Fig.4. Methane emissions from thawing permafrost. Source: Yumashev et al. (2019)
What Happens When Permafrost Thaws?
As temperature rises, frozen organic matter is made available for decomposition into CO2 if oxygen is available or CH4 if not. Since these warm the atmosphere in turn, a positive feedback, but also a vicious cycle is triggered.
Fig. 5. Permafrost positive feedback loop.
Impact of Global Temperature on Permafrost
Polar and high altitude areas are more sensitive to climate change than the rest of the world. They have been warming at three times the global average rate, as demonstrated by exceptionally intense wildfire seasons and rapid glacier melt. Permafrost loss is less obvious but just as worrisome. A detailed study revealed that, on average, permafrost around the Arctic, Antarctic, and the high mountain warmed by 0.3 °C between 2007 and 2016.
Fig. 6. Annual permafrost temperature change for Northern Hemisphere. Source: Biskaborn et al.(2019).
How to Stop Permafrost from Thawing
Permafrost thawing can be controlled by curtailing our carbon footprint, purchasing environmentally friendly goods, and encouraging eco-friendly businesses, regulations, and policies. Other more imaginative methods include:
1. Using Herds of Hoofed Herbivores
A recent study published by Beer et al. 2020 in the Scientific Reports, a Nature journal reveals the possibility of using hoofed herbivores such as herds of horses, bison, and reindeer, etc. to prevent the thawing of permafrost. According to the authors, “increasing the population density of large herbivores in the Northern high-latitude will increase snow density and therefore minimize the insulation strength of snow during the wintertime”. The animals trample by compacting the snow surface, allowing cold air to reach the ground.
2. Using Plants
Researchers from the University of Edinburgh are developing a novel research into the potential application of plants in preventing permafrost from thawing. Plant habitats play an important role in regulating the soil temperature. They provide shade for permafrost soil from direct heat of the sun, and their roots eliminate water making them better insulators.
Baert, J.M., Janssen, C.R., Borga, K., De Laender, F., (2013). Migration and opportunistic feeding increase PCB accumulation in Arctic seabirds. Environ. Sci. Technol. 47, 11793–11801.
Beer, C., Zimov, N., Olofsson, J., et al. (2020). Protection of Permafrost from Thawing by Increasing Herbivore Density. Sci Rep 10, 4170.
Biskaborn, B.K., Smith, S.L., Noetzli, J. et al. (2019). Permafrost is warming at a global scale. Nat Commun, 10, 264.
Brown, J., O.J. Ferrians, Jr., J.A. Heginbottom, and E.S. Melnikov, eds. (1997). Circum-Arctic map of permafrost and ground-ice conditions. Washington, DC: U.S. Geological Survey in Cooperation with the Circum-Pacific Council for Energy and Mineral Resources. Circum-Pacific Map Series CP-45, scale 1:10,000,000, 1 sheet.
Knoblauch, C., Beer, C., Liebner, S., Grigoriev, M.N, Pfeiffer, E.M. (2018): Methane production as key to the greenhouse gas budget of thawing permafrost; Nature ClimChange, 8, 309-312.
Ying, K., Cheng-Hai, W. (2017).Responses and changes in the permafrost and snow water equivalent in the Northern Hemisphere under a scenario of 1.5 °C warming. Advances in Climate Change Research, 8:235e244.
Yumashev, D., Hope, C., Schaefer, K. et al. (2019). Climate policy implications of nonlinear decline of Arctic land permafrost and other cryosphere elements. Nat Commun, 10, 1900.
The UN’s Intergovernmental Panel on Climate Change (IPCC) kicked off its 2021 report with the following statement: “It is unequivocal that human influence has warmed the atmosphere, ocean and land.”
How are we so certain? It took a while but climate modelling is now refined enough to predict how things would go without human influence, within a margin of error. What we are observing today, however, is beyond that margin of error, therefore proving that we have driven the change.
2. The last decade was the hottest in 125,000 years
Most straightforward of our climate change facts: according to the IPCC’s sixth assessment report on the state of our climate, the past decade is likely to have been the hottest period in the last 125,000 years. For about 100,000 years, we have been oscillating between glacial (ice ages) and warmer interglacial periods like the one we currently live in. Yet, this is also the warmest multi-century period we have had in this timespan.
Source: IPCC, 2021.
The vertical bar on the left shows the estimated temperature (very likely range) during the warmest multi-century period in the last 100,000 years, which occurred around 6,500 years ago during our current era called the Holocene. Only around 125,000 years ago, a time prior to the last ice age, might have had higher temperature than the ones we are currently experiencing. Each of these past warm periods were caused by slow (multi-millennial) orbital variations that are not in play today.
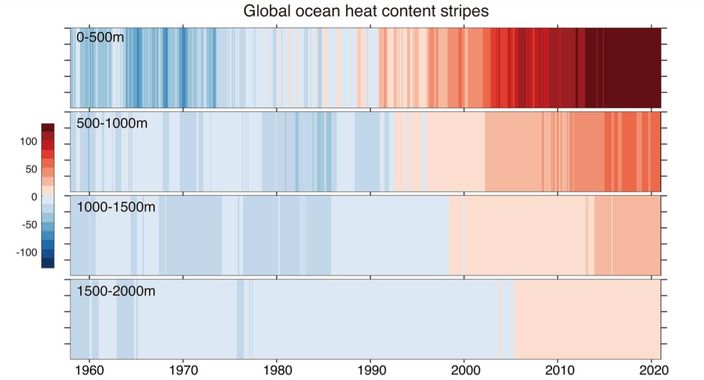
3. The ocean absorbs most of the heat we produce
A 2019 study found that oceans had sucked up 90% of the heat gained by the planet between 1971 and 2010. Another found that it absorbed 20 sextillion joules of heat in 2020 – equivalent to two Hiroshima bombs per second.
The ocean has tremendous volume and heat-storage capacity, which is why some organisms are used to temperatures being quite stable. Of these, coral reefs are particularly sensitive to temperature levels, reason for which many are now dying off.
4. CO2 is at its highest in 2 million years
Pre-industrial CO2 levels were around 280 parts per million (ppm). Today, we stand close to 420 ppm.
Source: NASA.
The most distant period in time for which we have estimated CO2 levels is around the Ordovician period, 500 million years ago.
Source: Descent into the Icehouse.
Once again, the ocean comes to our rescue by absorbing about one-third of the carbon in the atmosphere. Before the industrial revolution, it was actually a source of carbon, and not a sink, but the massive amount of CO2 now in the atmosphere has forced it to start absorbing the gas.
5. We are losing 1.2 trillion tons of ice each year
This item on our list of climate change facts can be hard to comprehend because we are dealing with volume beyond our comprehension.
Since the mid-1990s, we’ve lost around 28 trillion tons of ice, with today’s melt rate standing at 1.2 trillion tons a year. To help you put that into perspective, the combined weight of all human-made things is 1.1 trillion tons. That’s about the same weight as all living things on earth.
It was recently found that air pollution kills more than 9 million people per year. Developing hotspots in south Asia and Africa will be dealing with poor air quality for years to come, but there is a silver lining.
Polluting particles, such as PM10 or PM2.5, which cause adverse health effects similar to those of cigarettes, actually reflect the sun’s heat rather than trap it. We’ve pumped enough greenhouse gases into the atmosphere to warm it by 1.5C already, but fine particles have kept it around 1.1C so far.
Some have proposed intentionally disseminating particles into the atmosphere to help reflect more sunlight, but potential unforeseen consequences have prevented us from doing so.
7. Attribution is now possible (extreme weather)
We can now attribute natural disasters to human-driven climate change with certainty. This hasn’t always been the case, as a lack of data and refined techniques for detecting attribution made it hard to tell how much we had to do with each extreme weather events.
We can now say with precision how much likelier we made things like the North American summer 2021 heatwave, which the World Weather Attribution says was “virtually impossible” without climate change as well as the Indian heatwave, which experts believe it was made 30 times more likely because of climate change.
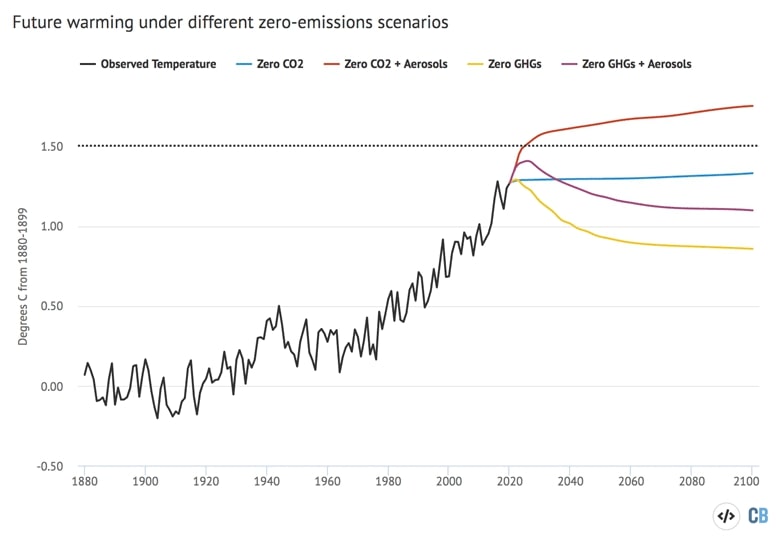
If global net emissions were entirely ceased, the warming we’ve caused would gradually reverse but other climate-induced changes would continue for decades if not centuries. For example, sea level rise would probably take millennia to reverse its course.
Source: Carbon Brief.
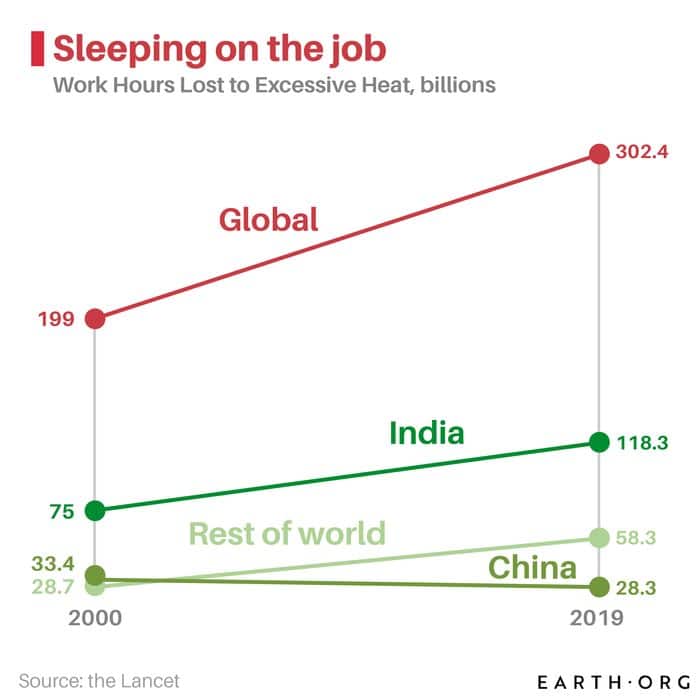
9. We lost 302.4 billion work hours to excessive heat in 2019
If you have ever been in humid South East Asia on a hot August day, you will know that working outdoors with shade is barely feasible, and without, simply dangerous. A report from The Lancet found that the number of work hours lost to heat across the globe increased from 199 billion in 2000 to 295 billion in 2020. That is equivalent to 88 work hours per employed person.
Of course, daytime outdoor labor is most exposed, which often targets lower-income areas and professions, especially agriculture.
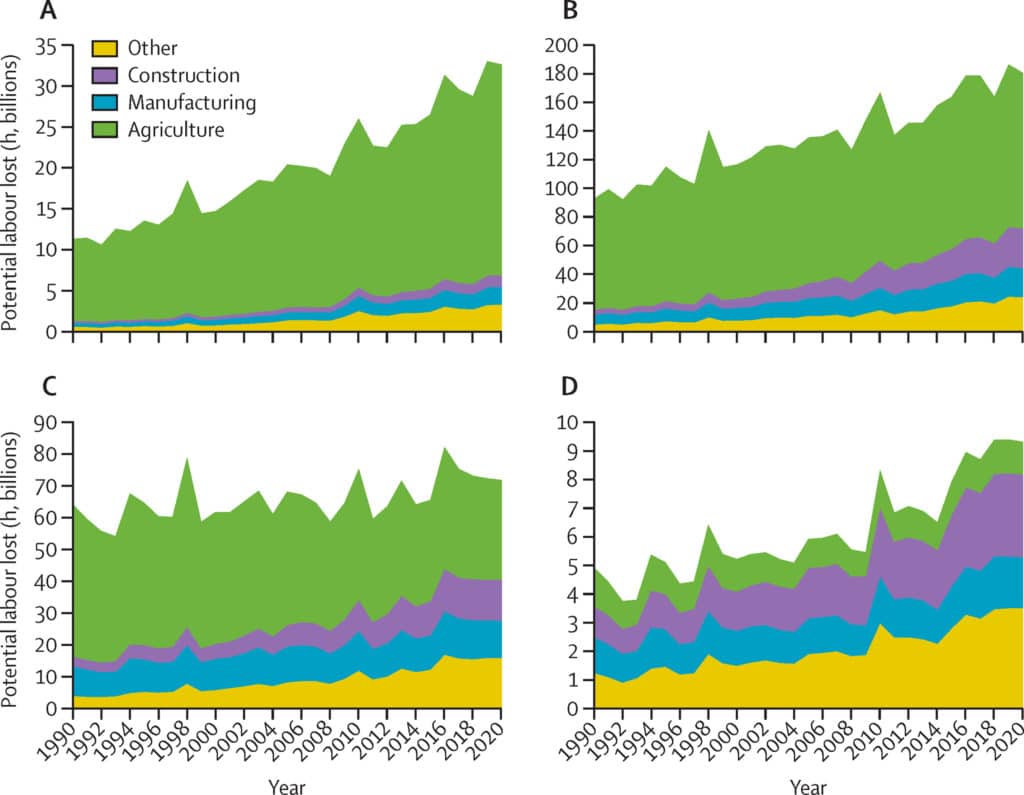
Potential labour lost due to heat-related factors in each sector (1990–2000) Low HDI (A), medium HDI (B), high HDI (C), and very high HDI (D) groups (2019 HDI country group). HDI=human development index. Source: The Lancet
10. It could become too hot to live in many places by the end of the century
This may the most catastrophic of our climate change facts. As of now, only 0.8% of the planet’s land surface has mean annual temperatures above 29°C, mostly in the Sahara desert and Saudi Arabia (solid black in the map below).
A study by Xu et al. (2020) called “Future of the Human Niche” found that by 2070, under a high emissions scenario, these unbearable temperatures could expand to affect up to 3 billion people (black hashes).
Source: Xu et al. 2020, Future of the Human Niche.
Lost work hours are only one example of the impacts of extreme heat, especially when sustained over long periods. Others include agriculture yield losses, the spread of disease-carrying mosquitoes, and the increased need for air conditioning with its accompanying energy consumption.
11. The cost of inaction is higher than the opposite
On the current path, climate change could end up costing us 11 to 14% of the global GDP by mid-century. Regression into a high emissions scenario would mean an 18% loss, while staying below 2°C would reduce the damage to only 4%.
It has been proposed that ending climate change would take between $300 billion and $50 trillion over the next two decades. Even if $50 trillion is the price tag, that comes down to $2.5 trillion a year, or just over 3% of the global GDP.
Climate change is an incredibly complex phenomenon, and there are many other things happening that were not covered above. If you want to learn more, please visit our data visualization page!
This story is funded by readers like you
Our non-profit newsroom provides climate coverage free of charge and advertising. Your one-off or monthly donations play a crucial role in supporting our operations, expanding our reach, and maintaining our editorial independence.
Fossil fuels pick up the slack when renewables can’t meet demand, either because of bad weather conditions or insufficient capacity. This is why energy storage is a crucial component for a sustainable future, as it counterbalances renewable energy’s intermittent nature.
Battery storage capacity additions hit 5 GW in 2020, up 50% from a “mediocre” 2019 and enough to power 3.75 million homes. Bloomberg NEF predicts that the global energy storage market will grow 20-fold by 2030, hitting the one terawatt-hour mark with China and the U.S. leading the charge.
Still, according to the IEA, it isn’t enough to align with the Net Zero Emissions by 2050 scenario.
Exploring the Metric
Energy storage isn’t just about making up for wind and solar intermittency: it opens a range of solutions for smart grids that can make the overall system more efficient and resilient, regardless of the generation sources. As an example, machine learning could help better predict energy demand patterns and prepare accordingly.
As of today, China, Europe and the U.S. are leading the energy storage market’s rebound after a paltry year in 2019 where new installations failed to rise for the first time in a decade. Total capacity stood at 17GW worldwide by the end of 2020, and overall investment increased by 40% to USD 5.5 billion.
National policies will widely dictate the sector’s growth, as new solutions that require broad changes are rarely considered before governmental greenlights and incentives are given. The U.S. and China have been mandating targets for energy storage installation, which is why Bloomberg NEF expects them to claim over half the global installations by 2030.
Other countries making big pushes are India, Australia, Germany, the U.K. and Japan. Regions like the Middle East and Africa lag behind, but we can expect them to catch up as renewables penetrate their markets.
Customer-sited batteries will also grow, responding to a desire to consume self-generated solar power in business and homes. This could be an interesting development, especially if subsidized by local authorities – a U.S. federal study revealed that if Americans installed solar panels on every roof, it would supply 39% of the country’s total electricity.
Global sea levels have risen by 21-24 centimetres (8-9 inches) since 1880. At that rate, we’d only be in for another 8 centimetres by 2100, but sea level rise has accelerated. Standing around 1.4 millimetres per year throughout the twentieth century, it more than doubled to reach 3.6 millimetres per year between 2006 and 2015.
Even if we followed a low emissions pathway from today on (which is unlikely), global sea levels would probably rise at least 30 centimetres above 2000 levels by 2100. Conversely, if we follow a high emissions pathway, the worst-case scenario would mean sea levels 2.5 metres above 2000 levels.
Exploring the Stat
Sea level rise’s acceleration is due to both faster ice melt from glaciers and ice sheets and thermal expansion of seawater as it warms. Higher background water levels mean that storm surges push farther inland than they normally would, increasing the damage caused by events like Hurricane Katrina. Many spots along the U.S. coastline are also experiencing 300% to 900% more high-tide floods than 50 years ago; less deadly than hurricanes but still disruptive and expensive.
It is important to remember that the rise is not uniform around the world, and two different places at the same elevation may not be equally threatened. Jakarta, for example, is subsiding due to excessive groundwater extraction, making it extremely vulnerable to floods. Thermal, gravitational and wind dynamics can also make localized sea level rise faster than the global average.
In the near future, ports could also be compromised by the combination of rising sea levels and extreme weather. Key hubs in the Mediterranean, Arabic Peninsulas and South East Asia could be severely disrupted, left with a choice of adapting or displacing their infrastructure. The hit to shipping commerce, which represents 15% of global GDP, would be immense.
How We know
Sea levels have been monitored since the 18th century with tide gauges, and since the early 1990s with satellite altimetry. The relative contribution of thermal expansion was determined largely thanks to a fleet of aquatic robots, while that of ice melt is calculated with both on-site measurements and satellite-detected gravity shifts caused by water moving from land to ocean.
Future Outlook
How much sea level rise we face will depend largely on the rate of future greenhouse gas emissions. The biggest risk factors are tipping points in the polar ice systems, or thresholds past which they become committed to a large amount of ice loss, no matter our actions from then on. Because we don’t know when the tipping point might be reached, taking a safer approach and assuming it is right around the corner is best.
Many of the most vulnerable areas in the world are slowly erecting defences against sea level rise such as dykes, sea walls, and better water evacuation. However, most remain terribly unprepared, especially for the fact that the defences they built are likely to be overcome within 20 to 50 years.
For some, like Jakarta, the only option is displacement. How its 10.5 million inhabitants will do so remains to be seen, and the world will be watching.
This article was written by Owen Mulhern.
Check out our other indices here.
Why this Metric
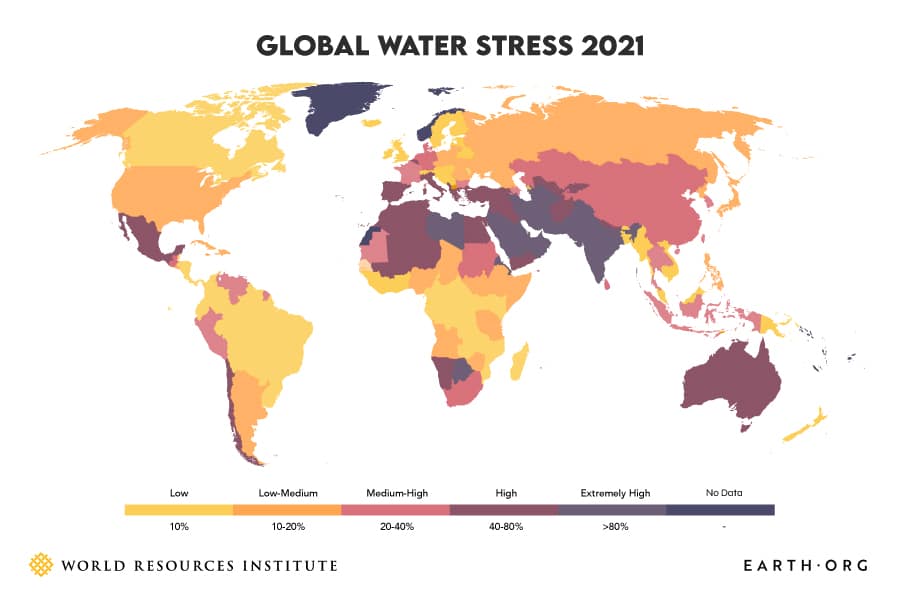
Air and water are the quintessential elements to life on Earth. Yet today, over 90% of the population breathes unsafe levels of pollutants, and four billion people experience severe water scarcity for at least one month a year. Of these four billion, 1 billion live in India and another 0.9 billion in China.
Major cities around the world, like Cape Town, Beijing or Chennai have faced “Day Zero”, the day the tap runs dry. 17 countries, home to a quarter of the world’s population, face “extreme water stress”, according to the World Resources Institute’s (WRI) Aqueduct Water Risk Atlas, whose data we have mapped above.
Exploring the Metric
Water is essential for food production, electricity generation, manufacturing, and many other cogs of human society. What does water stress look like? In large cities, its residents standing in line for hours to get water from government tanks, and covid-reminiscent shutdowns of many commercial activities.
In unstable regions like that of the Sahel (the southern border of the Sahara), water stress can lead to, and exacerbate food insecurity and conflict. In Somalia for example, drought forced rural communities to sell off more livestock than usual, leading to a drop in prices and plummeting rural incomes. Poverty incentivizes illicit activities and extremism, which fuelled the rise of terrorist groups like Al Shabaab whose fighters are offered cash revenue.
In addition to drought, many draw water from untreated, dangerous sources that put them and their children at risk of disease. The World Health Organization estimates that ~3.6 million people, 2.2 million of which are children, die from water-related disease each year.
Where the Numbers Come From
The WRI’s Aqueduct tool was built off a number of data sources, including academic papers, WHO reports, hydrological modelling and remotely sensed (satellite) information.
It is all compiled into a set of freely available resources, including the Aqueduct Water Risk Atlas, Aqueduct Food, Aqueduct Floods, and Aqueduct Country Rankings, designed for decision makers, private entities and the general public.
Future Outlook
Higher temperatures widely modify the Planet’s water cycle, especially in the atmosphere. For every 1°C it warms, its water-carrying capacity increases by 7% (according to the Clausius-Clapeyron relation). The current consensus is that this will make droughts drier, floods wetter and both more frequent.
UNICEF reports that some 700 million people could be displaced by intense water scarcity by 2030, projecting it to be one of the main drivers of future climate migration. Farmers in Honduras and Guatemala are already mass migrating north to escape crop-killing droughts, hurricanes and hunger.
With the world tilting toward protectionism and closed borders, these people are unlikely to be given safe haven, meaning they’ll end up in massive refugee camps where they’ll remain exposed to the elements, hunger and disease.
Water filtration technologies are improving and becoming more accessible, providing a small amount of relief. If developed countries start honoring their climate funding promise, those at risk could make some headway on better infrastructure and water stewardship. This issue will come down to international help and whether we start thinking as a global community.
This article was written by Owen Mulhern.
Check out our other indices here.
Why this Metric
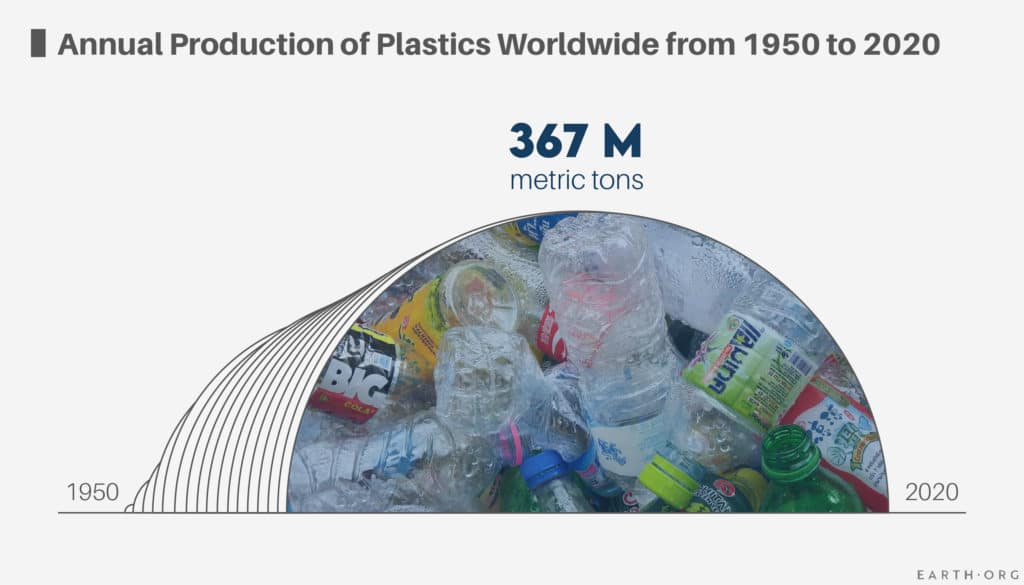
Plastic is lightweight, durable, cheap and can serve many purposes; we rarely go a day without seeing any. The plastic we now produce each year weighs as much as 2/3rds of humanity’s total mass. Around 300 million tons of plastic are thrown out annually, ending up in landfills or oceans where they linger for decades, centuries and even millenia.
Plastic pollution is so extensive, microscopic pieces have been found in the air, at the top of mount Everest, at the bottom of the ocean and, yes, even inside us. Why should you care? Because it is killing wildlife, vandalizing the beauty of nature and harming us too.
Exploring the Stat
Bakelite, the first commercially available plastic product, was launched in 1907 but mass production didn’t start until 1952. Since then, annual plastic production has increased nearly 200-fold, peaking in 2019 with 368 million tonnes and leveling off since.
The world used to ship most of its plastic to China, unconcerned about where it would end up next. However, in 2017, the Chinese government passed the National Sword policy and effectively banned wanton plastic import. Since then, many rich countries have found themselves with far more plastic than they can handle, and recycling has not massively improved.
Plastic accumulation in nature eventually works its way back to us, either through food or drink. The effects of ingested plastic on the human body has yet to be properly assessed, but it likely causes irritation, inflammation, and possibly carries toxins.
Where the numbers come from
A landmark study in 2015, led by Roland Geyer, identified and synthesized dispersed data on production, use and end-of-life management of polymer resins, synthetic fibers and additives to produce the first global estimate of all plastic ever produced.
There are also estimates from private research, such as the data produced by Statista.
Future Outlook
Making new plastic is far cheaper than recycling it, which is why only 9% of all plastics ever get recycled. Similar to the energy transition, it will require government intervention to readjust incentives and allow recycling to gain momentum, attract investment and become more optimized. Right now, environmental damage is shrugged off as an externality and doesn’t strike institutions as a financial loss.
As evidence of the detrimental effects of plastic pollution grows, more arguments will be available to usher in new legislation. In the meantime, hundreds of thousands of marine animals either die or suffer from plastic, while humans ingest a credit card’s worth each year and don’t even realize.
This article was written by Owen Mulhern.
Check out our other indices.
Subscribe to our newsletters
The best environmental stories of the week and month, handpicked by our Editor. Make sure you're on top of what's new in the climate.
Used to distinguish new sessions and visits. This cookie is set when the GA.js javascript library is loaded and there is no existing __utmb cookie. The cookie is updated every time data is sent to the Google Analytics server.
30 minutes after last activity
__utmc
Used only with old Urchin versions of Google Analytics and not with GA.js. Was used to distinguish between new sessions and visits at the end of a session.
End of session (browser)
__utmz
Contains information about the traffic source or campaign that directed user to the website. The cookie is set when the GA.js javascript is loaded and updated when data is sent to the Google Anaytics server
6 months after last activity
__utmv
Contains custom information set by the web developer via the _setCustomVar method in Google Analytics. This cookie is updated every time new data is sent to the Google Analytics server.
2 years after last activity
__utmx
Used to determine whether a user is included in an A / B or Multivariate test.
18 months
_ga
ID used to identify users
2 years
_gali
Used by Google Analytics to determine which links on a page are being clicked
30 seconds
_ga_
ID used to identify users
2 years
_gid
ID used to identify users for 24 hours after last activity
24 hours
_gat
Used to monitor number of Google Analytics server requests when using Google Tag Manager
1 minute
_gac_
Contains information related to marketing campaigns of the user. These are shared with Google AdWords / Google Ads when the Google Ads and Google Analytics accounts are linked together.
90 days
__utma
ID used to identify users and sessions
2 years after last activity
__utmt
Used to monitor number of Google Analytics server requests
10 minutes
You can find more information in our Cookie Policy and .